/MongoDB
Databases
MongoDB Monitoring
MongoDB is one of the leading NoSQL databases designed for scalability, high performance, and availability. This document-oriented database can be deployed in either stand-alone or clustered mode. The Moein monitoring system fully supports MongoDB monitoring in both configurations, collecting key performance indicators for databases, replica sets, shards, operations, transactions, and more. In clustered deployments, all cluster nodes are also monitored. The complete list of monitored metrics is provided below.

MongoDB General Information:
- Total Size On Disk
- Uptime
- Regular Asserts
- Warning Asserts
- Message Asserts
- User Asserts
- Rollovered Assert
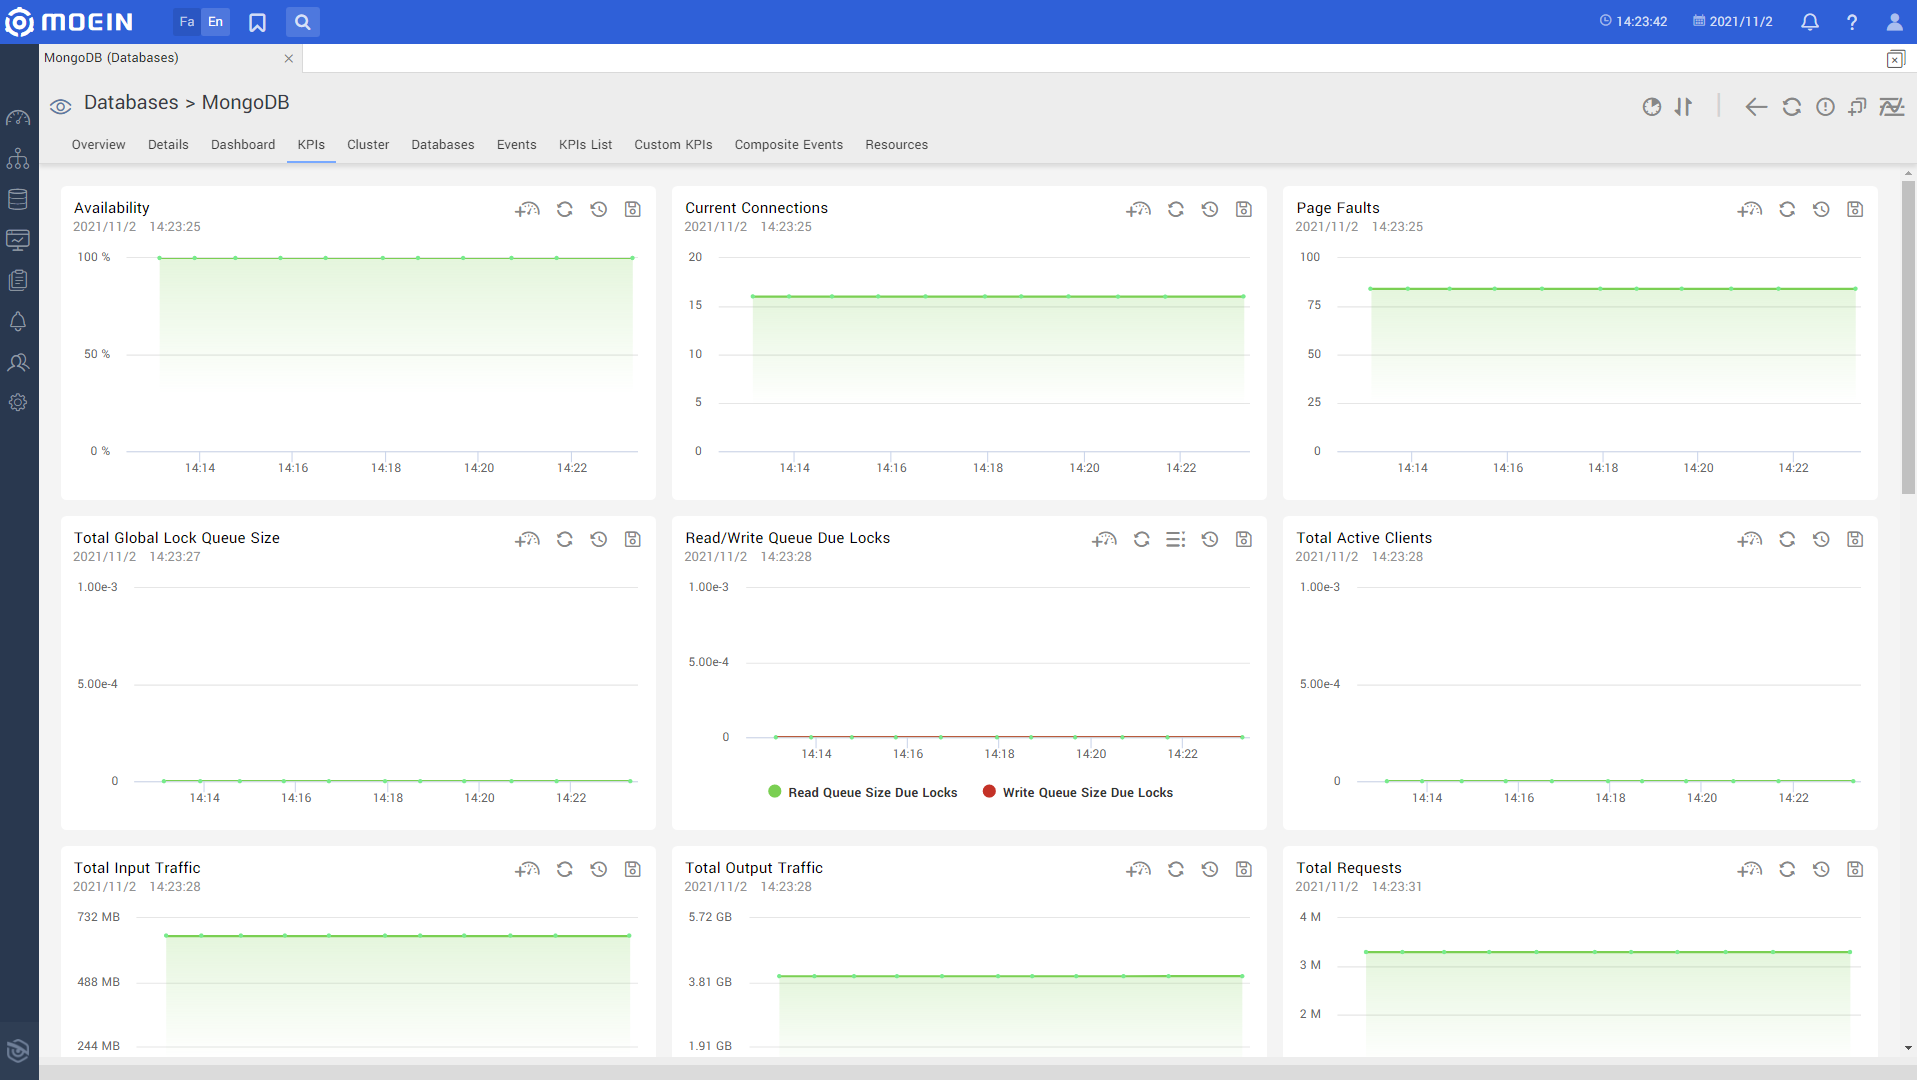
- Current Connections
- Available Connections
- Active Connections
- Page Faults
- Lock Total Time
- Total Global Lock Queue Size
- Read Queue Size Due Locks
- Write Queue Size Due Locks
- Total Active Clients
- Total Active Reader Clients
- Total Active Writer Clients
- Total Input Traffic
- Total Output Traffic
- Total Requests
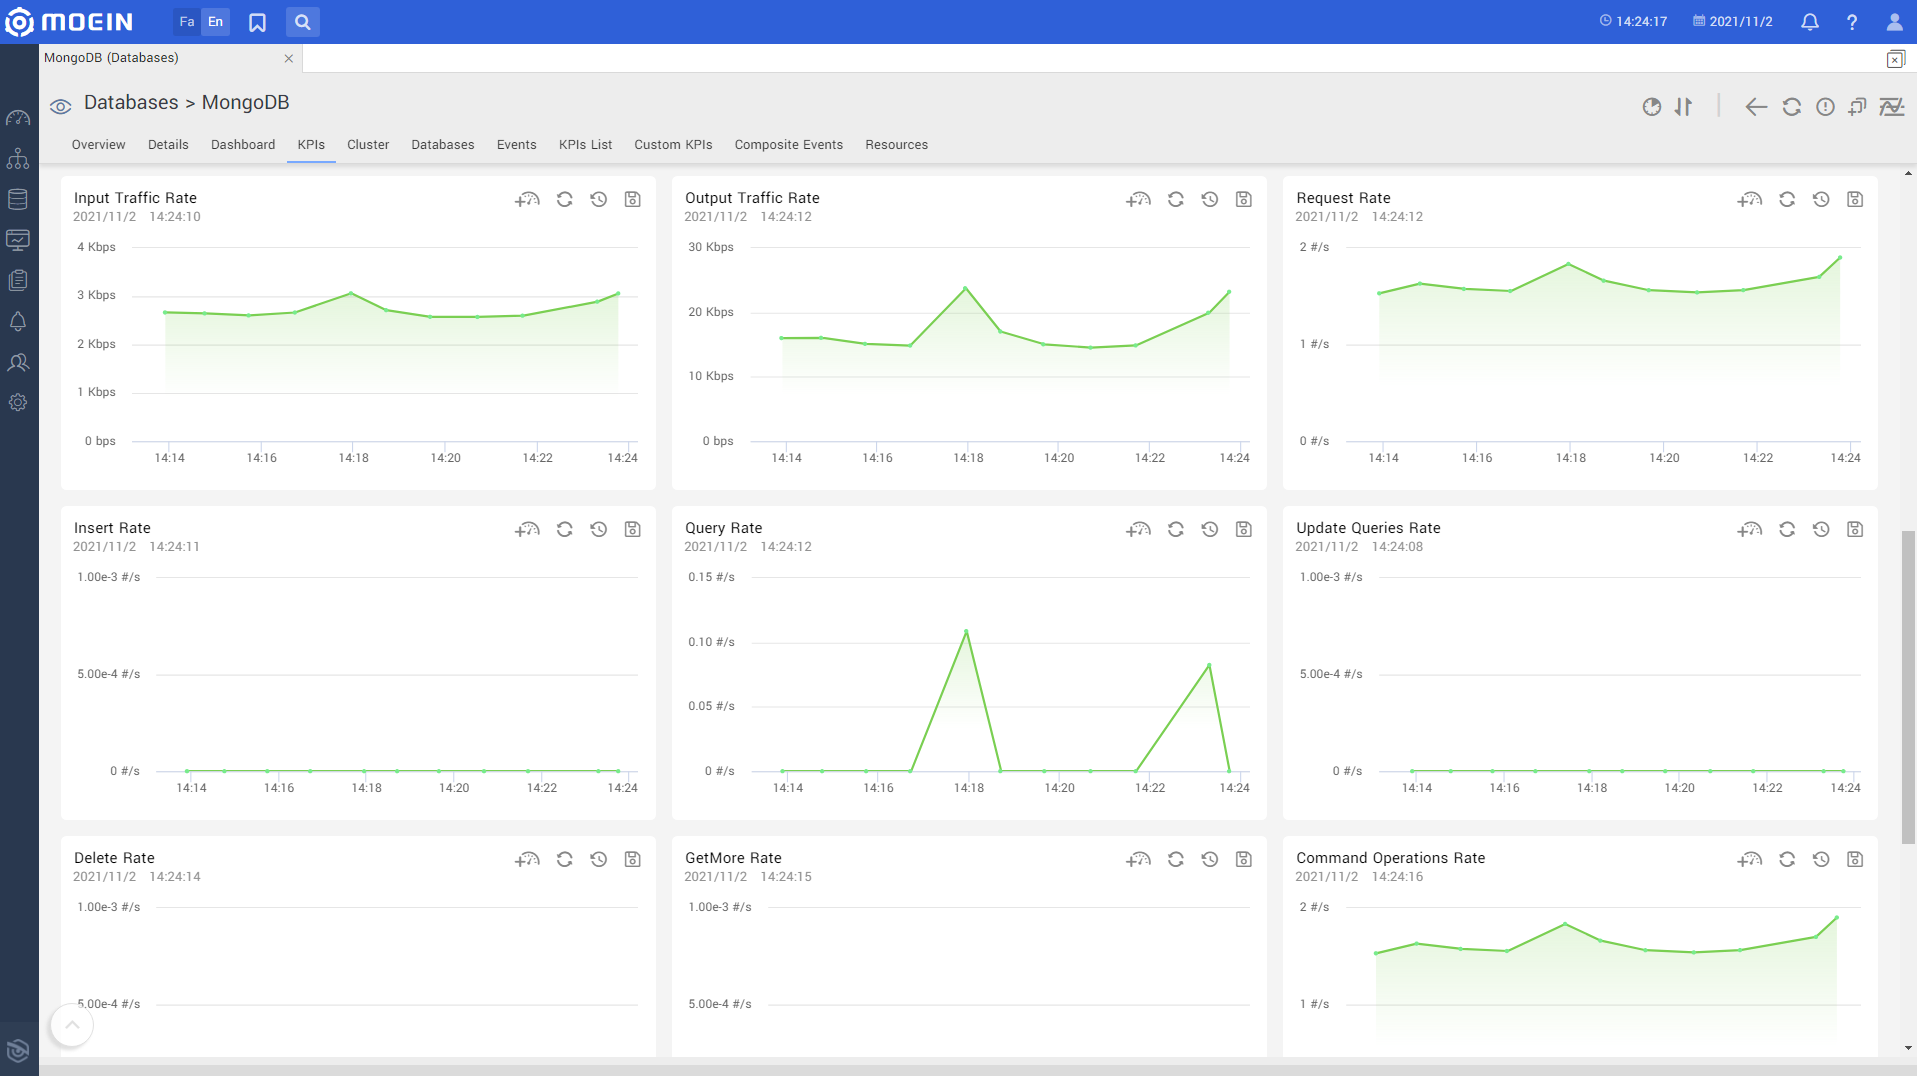
- Input Traffic Rate
- Output Traffic Rate
- Requests Rate
- Total Insert Queries
- Insert Rate
- Total Queries
- Query Rate
- Total Update Queries
- Update Queries Rate
- Total Delete Queries
- Delete Rate
- Getmore Operations
- Getmore Rate
- Number Of Command Operations
- Command Operations Rate
- Number Of Insert Operations
- Number Of Query Operations
- Number Of Update Operations
- Number Of Delete Operations
- Number Of GETMORE Operations
- Number Of Replication Commands
- Replications Host Lists
- Replication Set Name
- Node Type
- Primary Node Address
- Current Replication Node Address
- Rollback ID
- Retries Commands
- Retries Statements
- Open Active Transactions
- Open Inactive Transactions
- Open Transactions
- Aborted Transactions
- Committed Transactions
- Total Started Transactions
- Used Memory
- Virtual Memory Size
- Number Of Failed Commands Executions
- Command Total Executions
- Deleted Documents
- Inserted Documents
- Returned Documents
- Edited Documents
- Write Conflicts
- Oplog Operation In Buffer
- Maximum Buffer Size
- Oplog Buffer Size
- Process Name
- Config Server Cluster Name
- Config Server Cluster Members
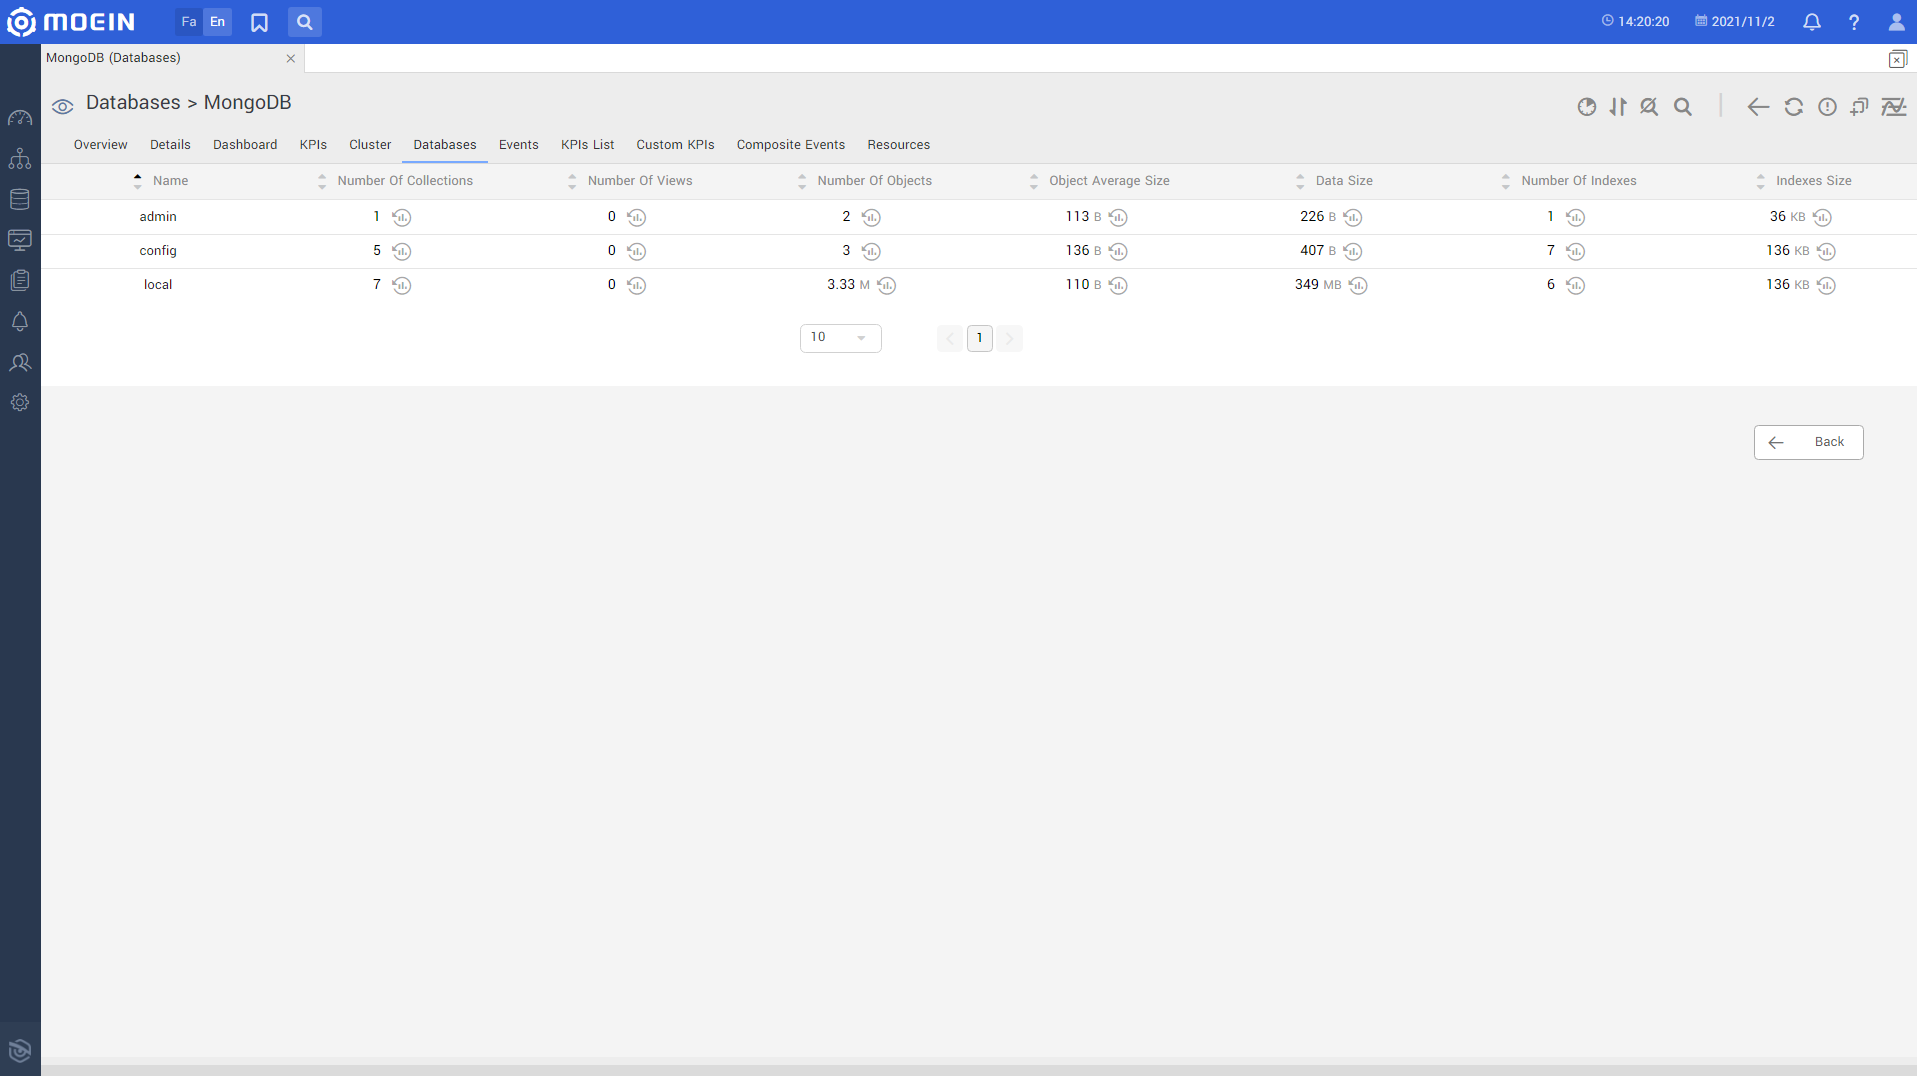
Database List:
- List Of Databases
- Database Size
- DB Empty Status
- Number Of Collections
- Number Of Views
- Number Of Objects
- Object Average Size
- Data Size
- Storage Size
- Number Of Extents
- Number Of Indexes
- Indexes Size
- Disk Used Size
- Disk Total Size
Replication Information:
- Cluster Set Name
- ID
- Members Name
- Current Member
- Health
- Status
- Uptime
- Primary Node Name
- IP Address

Communication Protocols:
- MongoDB
Databases
Behpaya Co. All rights reserved