/Microsoft SQL Server
Microsoft SQL Server Monitoring
Integrated operations monitoring system, Moein, is a monitoring system whose services expand to all layers of Information Technology (IT). As databases are among the most widely used service systems in IT domain, one side of Moein focuses on the monitoring of this type of application-level products. Monitoring Microsoft SQL database as one of the databases commonly used in the organization and medium scale is fully supported by Moein. Success ratio of cache and buffer, request time for connection, metrics related to the existing databases, Backup, Restore and Log Shipping metrics, key performance metrics related to sessions and top queries are some of the items that are provided to the administrators in this database. The details of the supported metrics of this database are presented below:

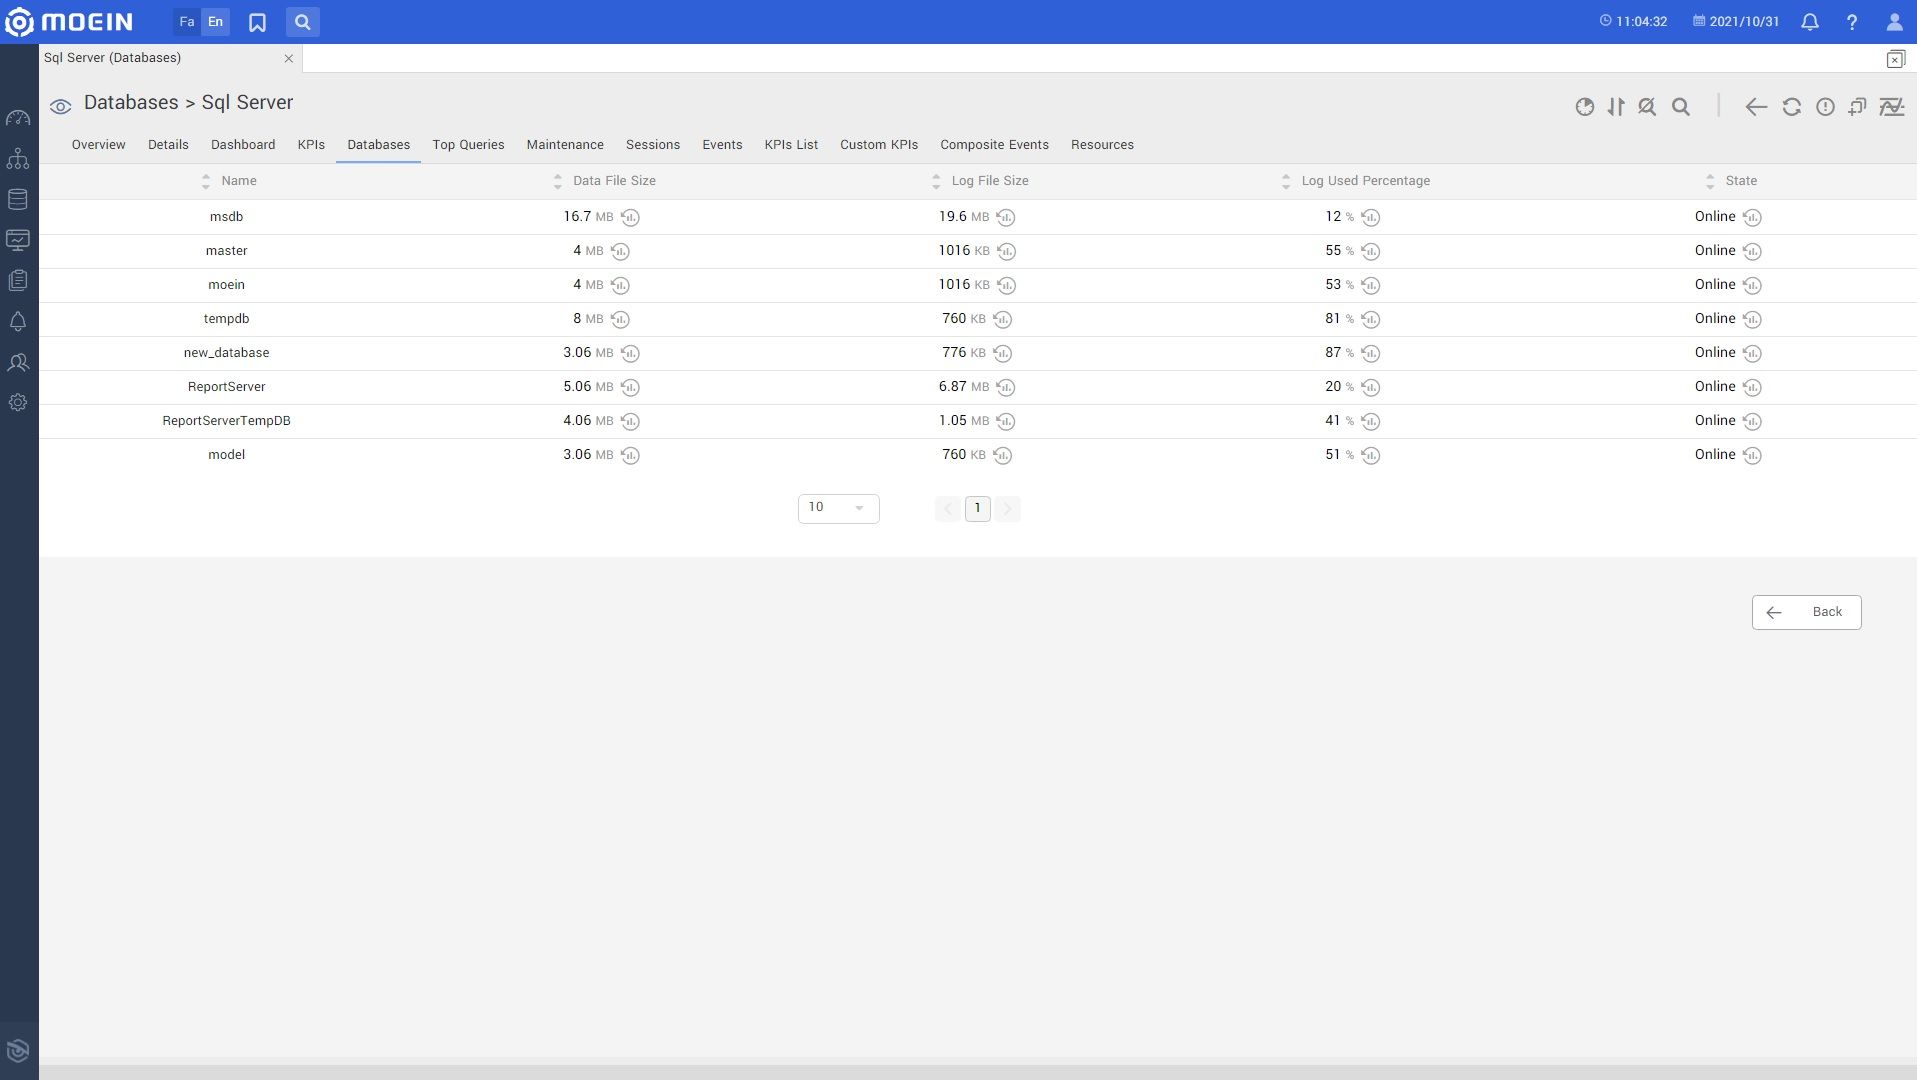
Metrics per database:
- Database ID
- Database Creation Date
- Database Status
- Database File Size
- Database Log File Size
- Database Log File Used Size
- Database Log File Used Percentage
Memory Metrics:
- Total System Memory Size
- SQL Cache Memory Size
- Lock Memory Used Size
- Optimizer Memory Used Size
- Connection Memory Used Size
- Granted WorkSpace Memory Size
- Memory Grants Pending
- Memory Grants Outstanding
- Stolen Server Memory
- Target Server Memory
- Total OS Memory Size
- Free OS Memory Size
- OS Memory Used Percentage
- Cache Memory Size
- Total Page File Size
- Page File Free Size
- Page File Used Percentage
- OS Memory Status
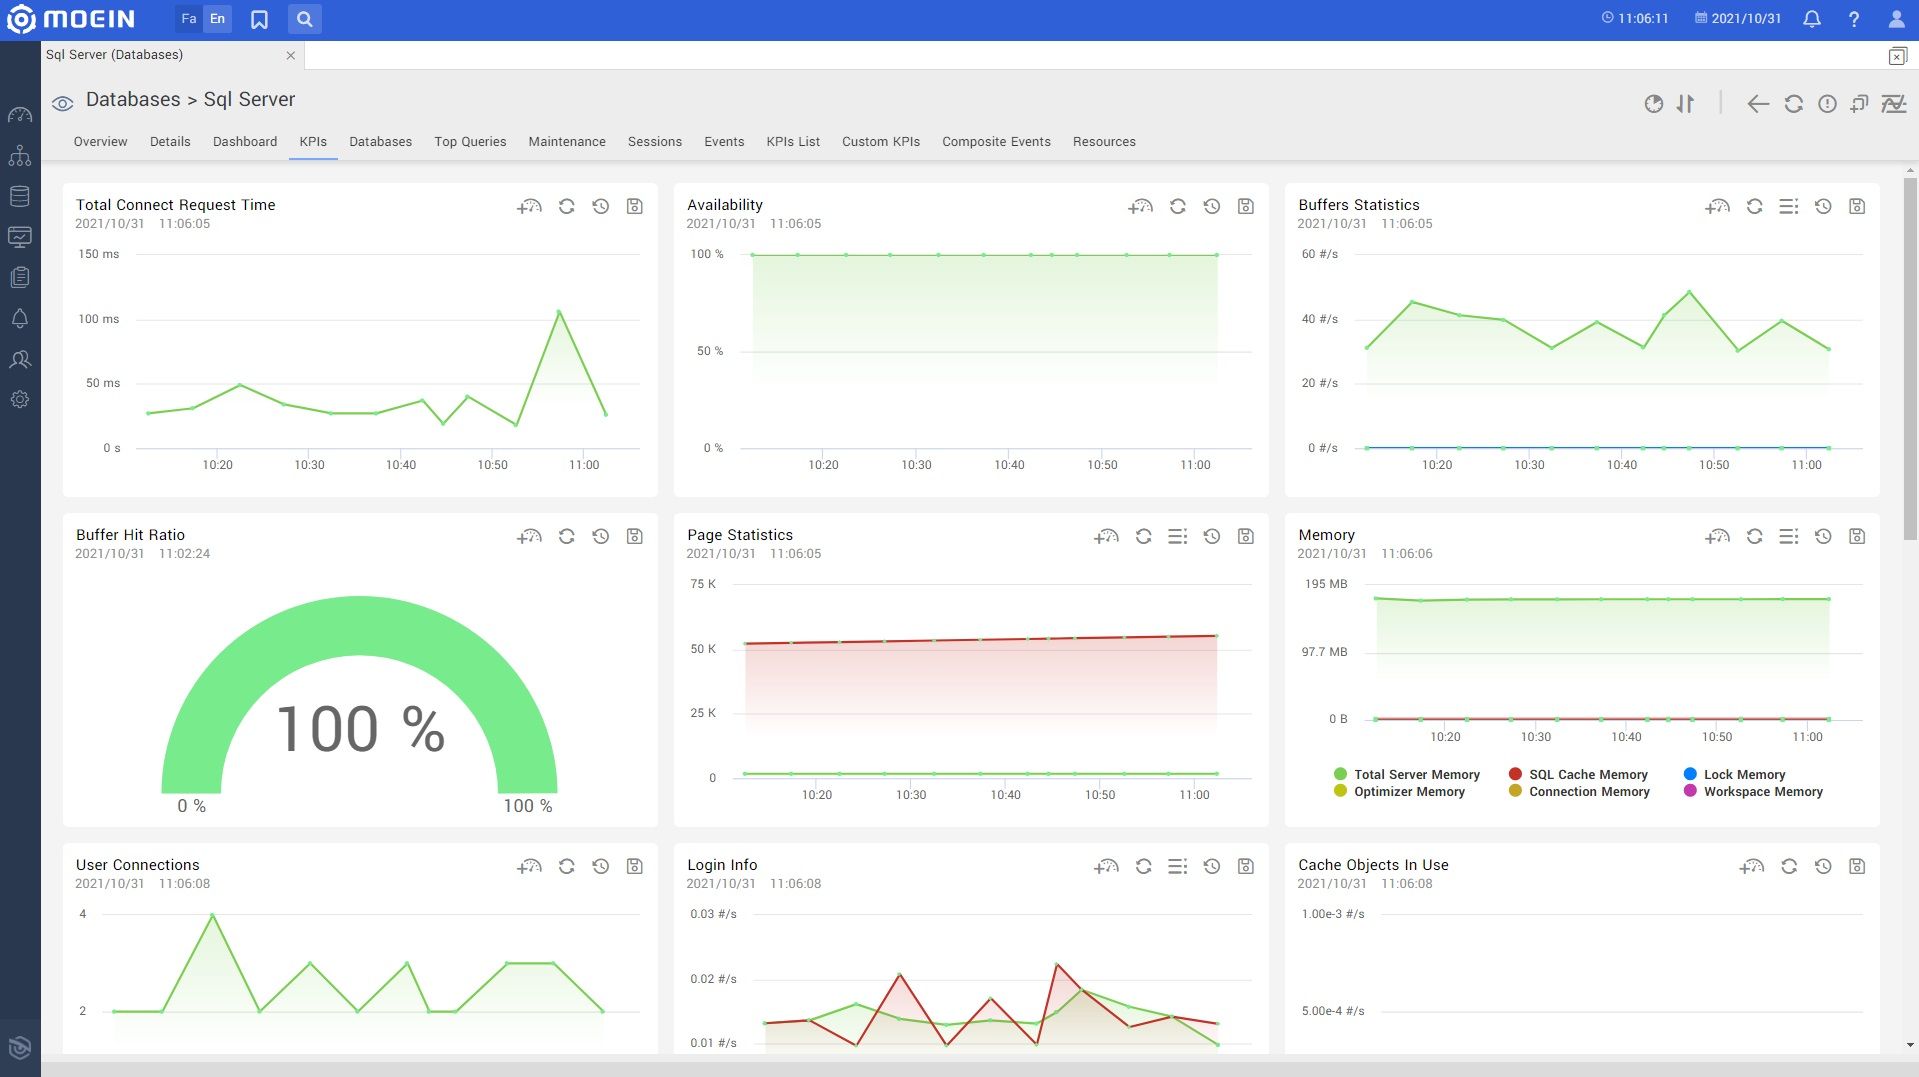
Buffer Metrics:
- Buffer Hit Ratio
- Page Lookups Rate
- Page read Rate
- Page Write Rate
- Database Pages
- Page Life Expectancy
Cache Metrics:
- Cache Hit Ratio
- Cache Objects In Use
- Number Of Cache Objects
- Cache Pages
Lock Metrics:
- Lock Request Rate
- Lock Waits Rate
- Lock Timeout Rate
- Deadlock Rate
- Average Lock Wait Time
Connections Metrics:
- User Connections
- Login Rate
- Logout Rate
SQL Transactions Statistics:
- Batch Requests Rate
- SQL Compilation Rate
- SQL Recompilation Rate
- Auto-Params Attempts Rate
- Failed Auto-Params Rate
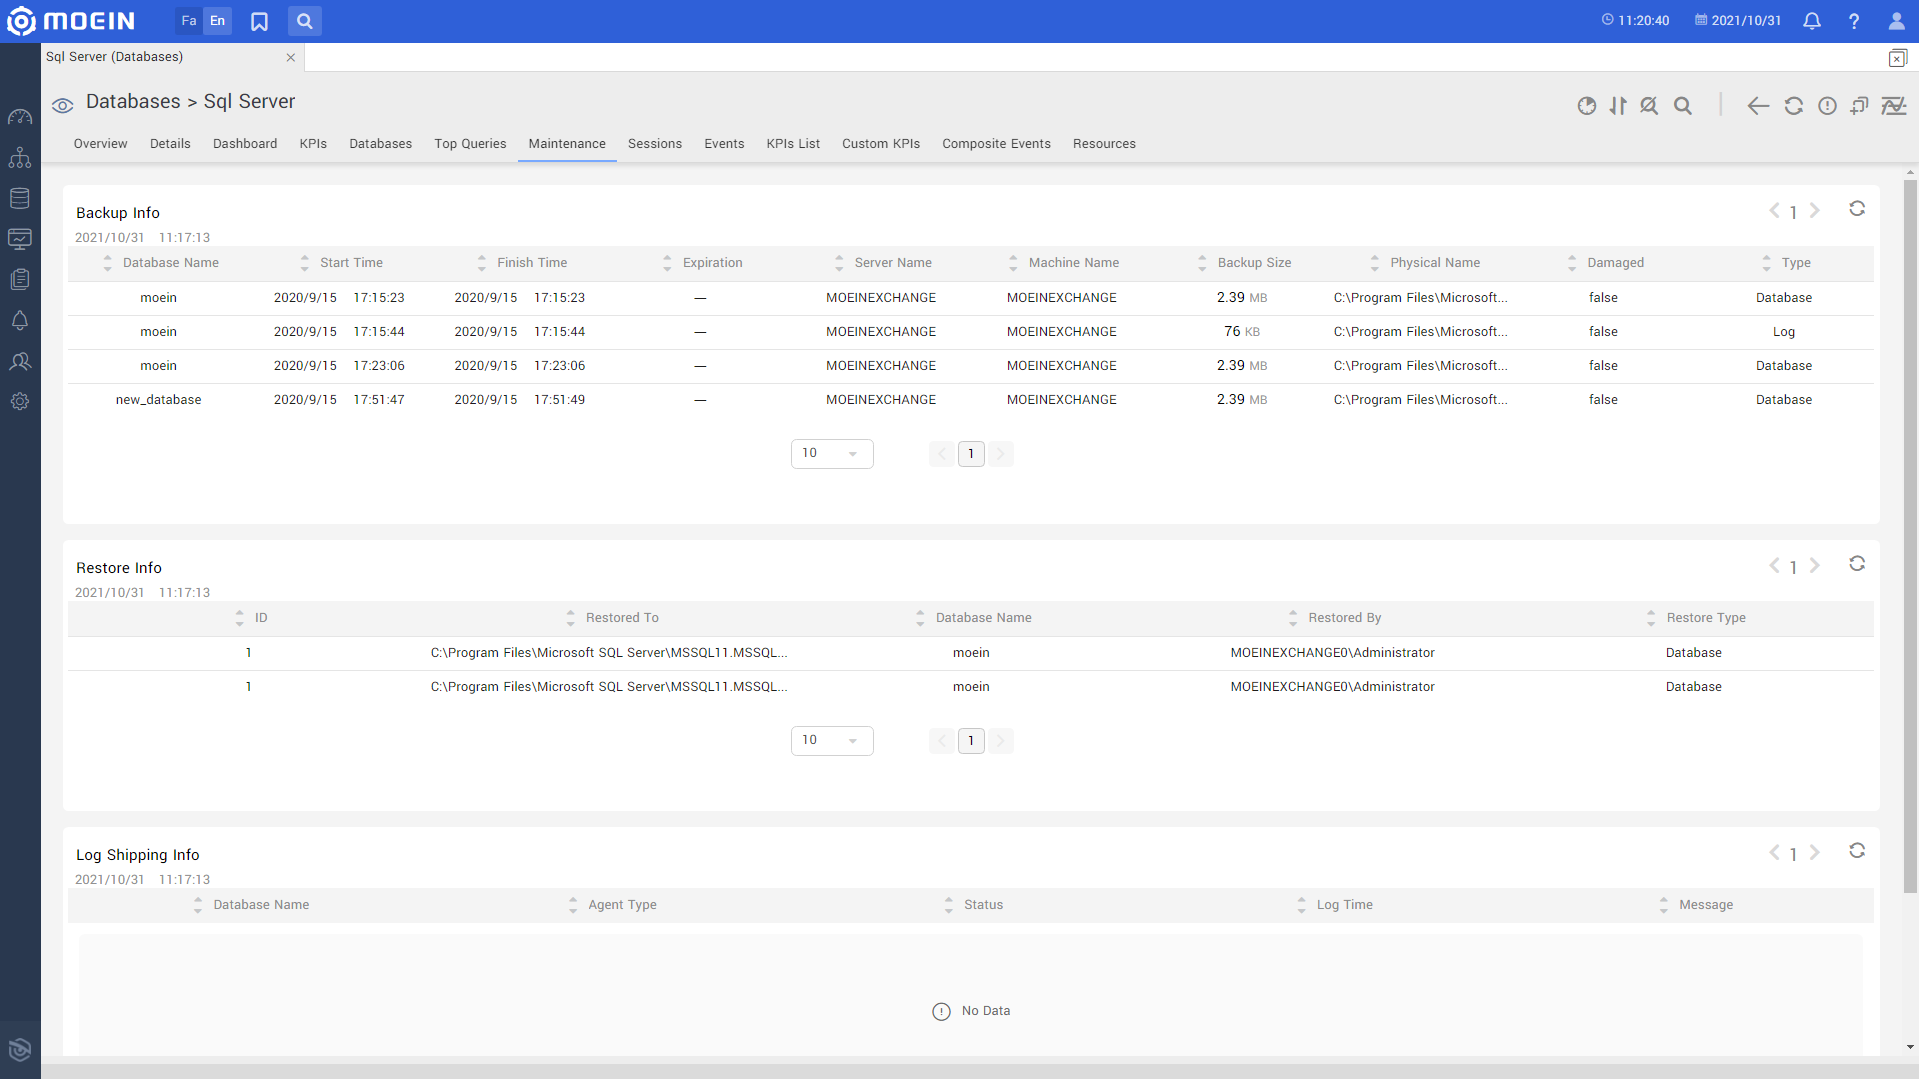
Backups information:
- List Of Backups
- Backup Status
- Backup Start Time
- Backup Finish Time
- Backup Size
- Backup Type
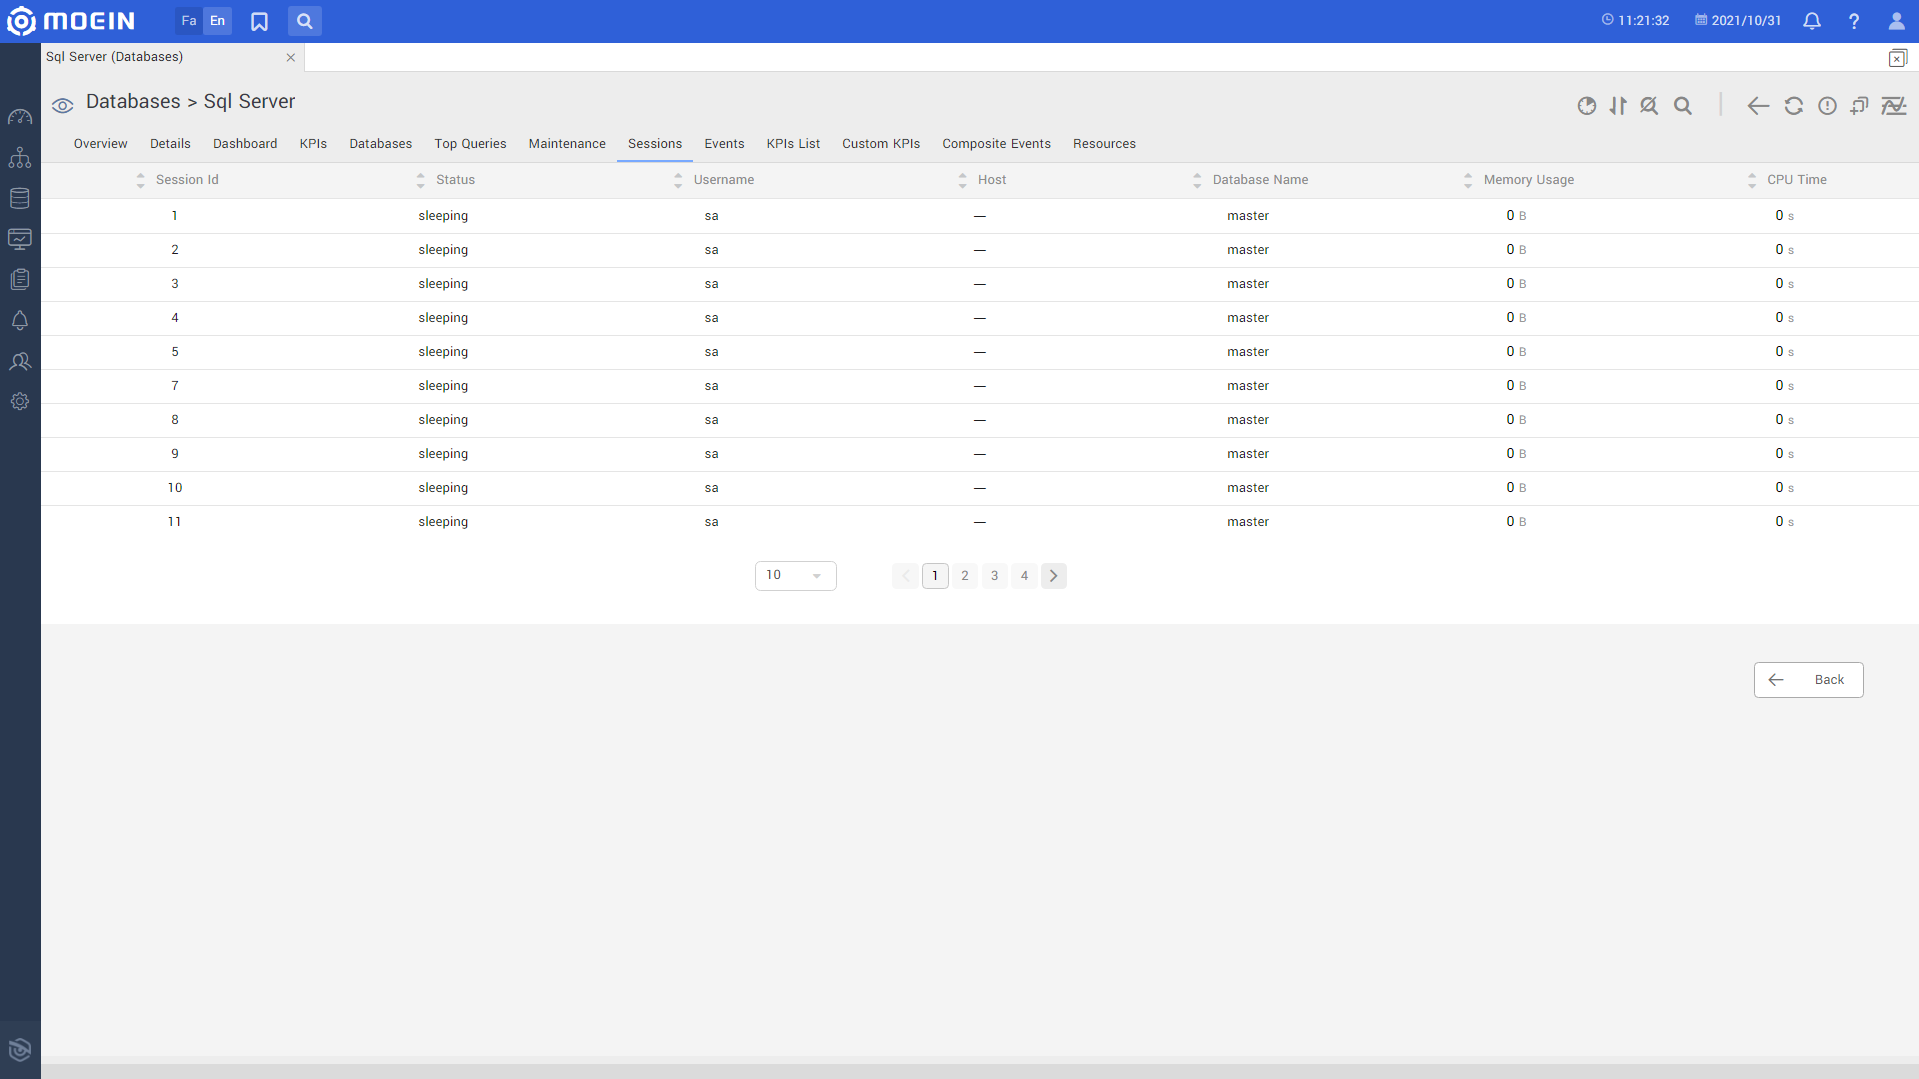
Sessions Metrics:
- List Of Sessions
- Session Status
- Database Name
- Username
- Session Memory Usage
- CPU Time
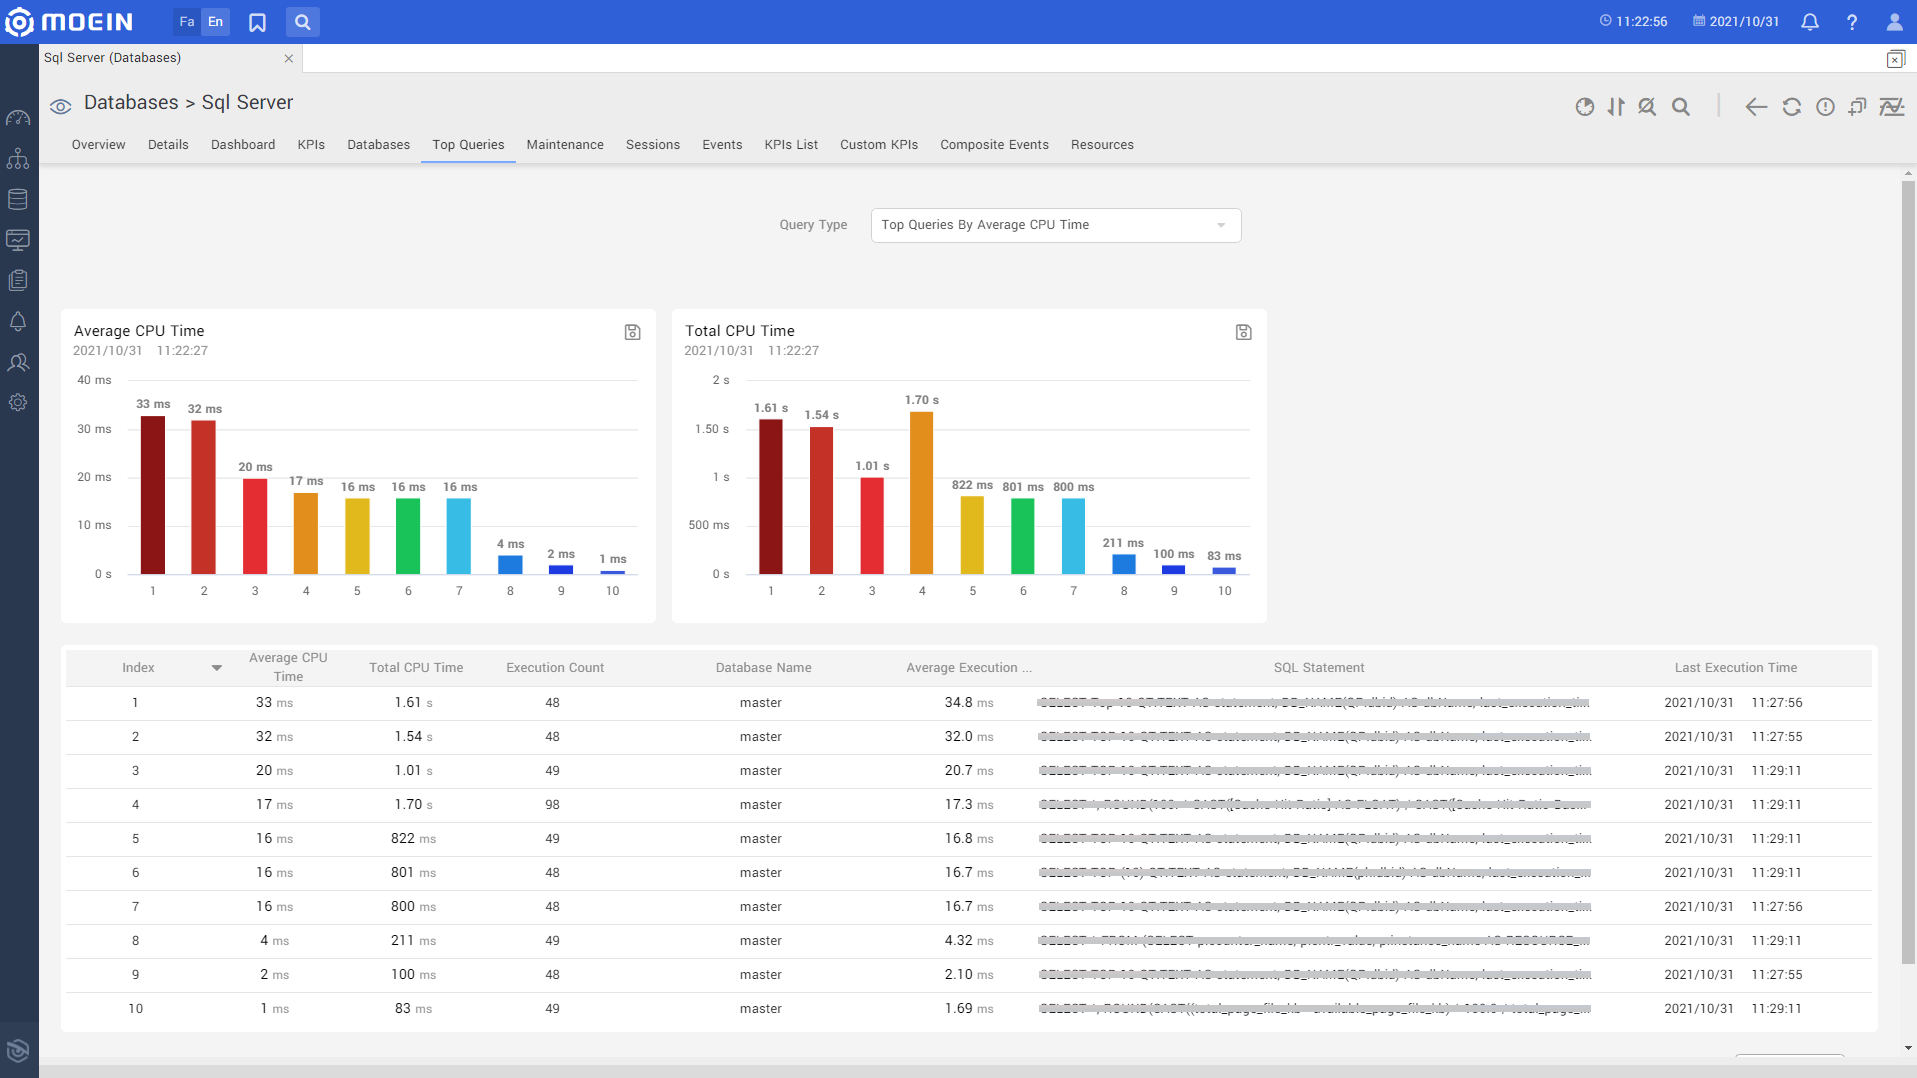
Top Queries in terms of different parameters:
- Top Queries with respect to Average CPU Time
- Most Frequently Executed Queries
- TOP Query with respect to IO usage
- TOP Query with respect to CLR
- Top Slow Running Queries
- Most Blocked Queries
- Top Queries with respect to (Lowest) Plan Reuse
Communication Protocols:
- JDBC