
Dissecting ManageEngine (Part Two): The Illusion of Unified Monitoring; From Stitched-Together Dashboards to True Core Integration

Before entering the discussion, it is necessary to emphasize that the goal of this series of articles is not to question the value or capability of the prominent IT infrastructure monitoring tools. Many of these solutions have been used in various organizations for years and play an important role in monitoring and managing IT environments. What is examined in this series of articles is more of an analytical look at some limitations and challenges that can become problematic for organizations. Therefore, if you intend to purchase ManageEngine software, we suggest that before making a decision, you also study the series of articles on dissecting ManageEngine.
In software architecture, systems that are assembled by combining multiple independent products are often referred to as “Frankenstein architectures.” While such designs may appear impressive in sales demonstrations, they frequently create serious operational challenges during real-world infrastructure incidents and outages.
ManageEngine is one of the platforms that delivers many of its monitoring capabilities as a collection of separate tools rather than a truly unified system. In this article, we examine the operational drawbacks of this architectural model and the challenges it introduces for infrastructure and operations teams.
One of the most popular concepts in infrastructure monitoring is the idea of a “Single Pane of Glass” — a unified view that provides visibility into the overall state of systems and services. ManageEngine has long marketed its products around this concept. However, once we move beyond the visual layer of dashboards and examine the underlying architecture, a different reality becomes apparent: what is presented as unified monitoring is often simply a collection of separate software products loosely connected through a shared user interface.
Stitched Dashboards: When ManageEngine Modules Do Not Truly Understand Each Other
Within the ManageEngine ecosystem, organizations typically rely on ManageEngine OpManager for network monitoring, ManageEngine Applications Manager for services and application monitoring, and ManageEngine NetFlow Analyzer for traffic analysis. Although these products may appear together within a single web portal, at the architectural level:
- Each product operates with its own completely independent processing engine.
- Every module maintains a separate database for storing information.
- Data collection logic and alerting mechanisms function independently from one another.
The result of this architecture is what can be described as an “illusion of integration.” There is no true system-level correlation between infrastructure events; each module analyzes only its own isolated dataset, while the broader operational picture must ultimately be reconstructed manually by the operator. In other words, the responsibility that should belong to the monitoring platform itself is effectively transferred to the human administrator.
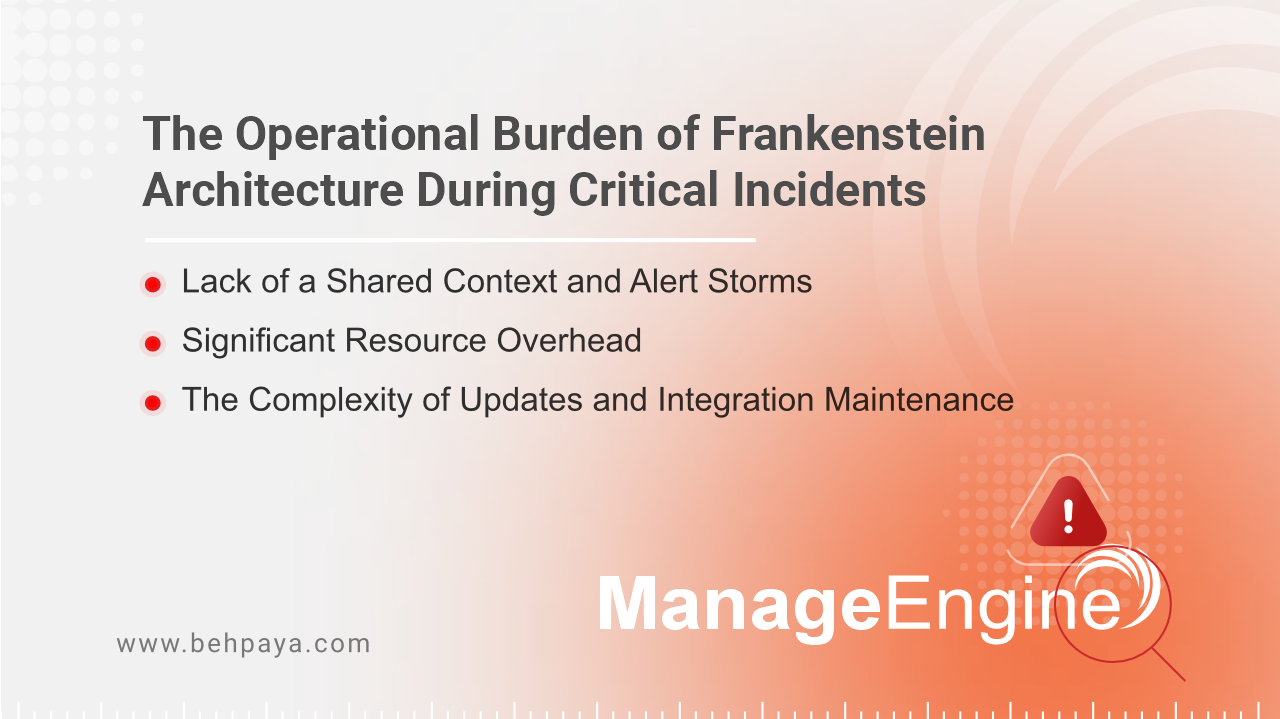
The Operational Burden of Frankenstein Architecture During Critical Incidents
When a critical enterprise service experiences disruption, rapid Root Cause Analysis (RCA) becomes essential. In architectures like ManageEngine, operations teams often encounter several major challenges:
1. Lack of a Shared Context and Alert Storms
If a database server encounters a failure, Applications Manager may generate one alert while OpManager simultaneously reports abnormal network behavior. However, the system lacks the architectural awareness required to understand that these events are related.
As a result, instead of receiving a single correlated and meaningful incident analysis, administrators are confronted with a flood of disconnected alerts. In critical environments, this can increase troubleshooting time from minutes to potentially hours — leading to extended service disruptions and degraded user experience.
2. Significant Resource Overhead
Running multiple independent Java-based engines alongside several separate databases consumes substantial server resources, including CPU and RAM. Over time, the monitoring platform itself can become a heavy operational burden on the infrastructure it is supposed to monitor.
3. The Complexity of Updates and Integration Maintenance
Upgrading a single module — such as updating OpManager — can potentially disrupt communication with other components, because these products were not originally designed as a deeply unified system at the architectural level.
Why “Integration at the Core” Matters
From a software architecture perspective, a truly integrated monitoring platform is not merely connected through a shared interface layer; integration exists at the architectural core of the system itself. In such platforms:
- Network, infrastructure, and service data are stored within a unified data model.
- All events pass through a centralized event-processing engine.
- Alerting, analytics, and event-correlation mechanisms operate on top of a shared data foundation.
Although this distinction may appear subtle, its operational impact is substantial. In platforms designed from the ground up around a unified core architecture — such as Moein Monitoring Platform — the system can recognize relationships between infrastructure events during incidents. Database degradation, service slowdowns, and declining user traffic can all be interpreted as symptoms of a single underlying issue. Instead of generating dozens of disconnected alerts, the platform presents a coherent operational picture of the problem.

In architectures such as ManageEngine, where integration primarily exists at the user-interface layer, each module still operates within its own isolated environment. Under these conditions, the responsibility for correlating events is effectively shifted from the platform to the human operator.
As a result, instead of simplifying infrastructure complexity, the monitoring system itself becomes an additional layer of operational complexity — one that can significantly reduce the speed of incident detection and response during critical situations.
Series of Articles on Dissecting ManageEngine




The Latest Articles
