Message Queues
Kafka Monitoring
Apache Kafka is an open source, distributed publish-subscribe messaging system. It is used by thousands of companies for high-performance data pipelines, streaming analytics, data integration, and mission-critical applications. Moein monitoring system is capable of monitoring Kafka by collecting performance metrics of broker, topics, consumers, producers, and Java Virtual Machine (JVM). Performance indicators of this queuing system are:

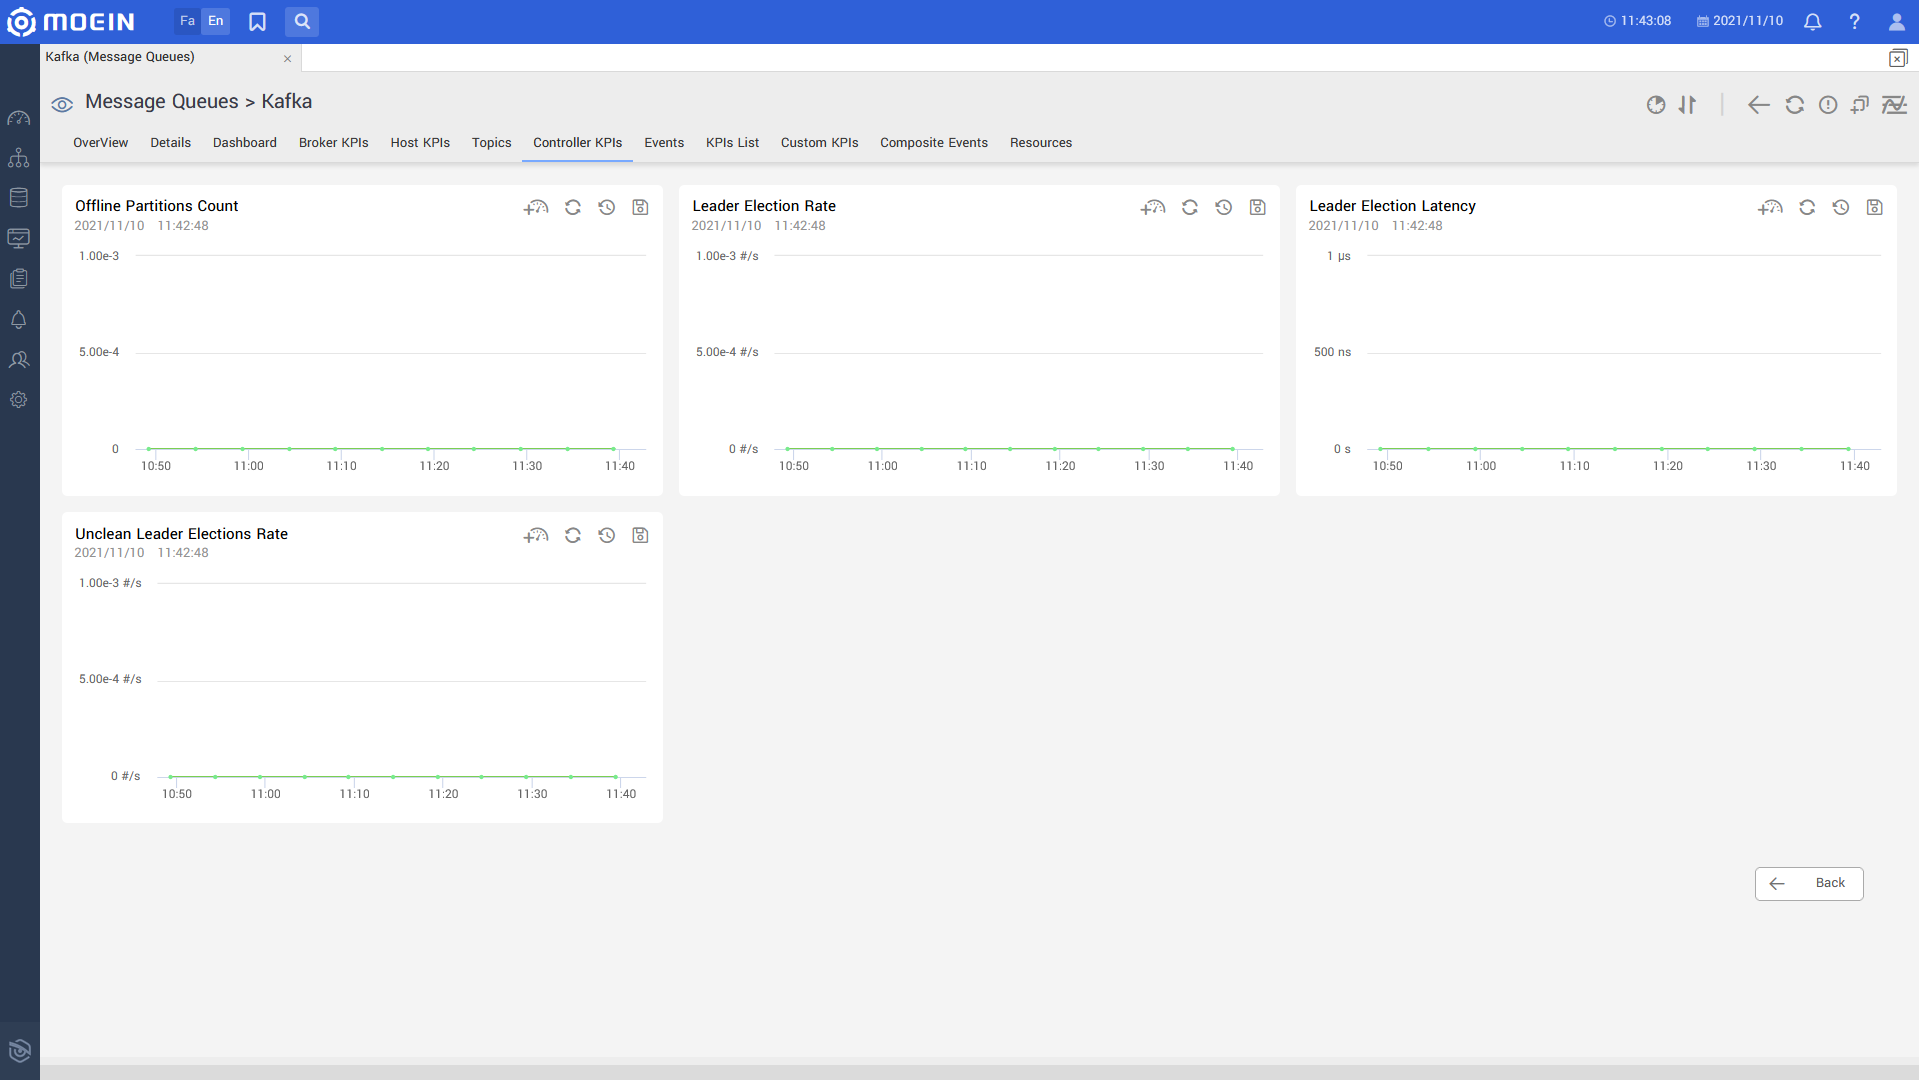
Controller:
- Active Controller Count
- Offline Partitions Count
- Leader Election Rate
- Leader Election Latency
- Unclean Leader Elections Rate
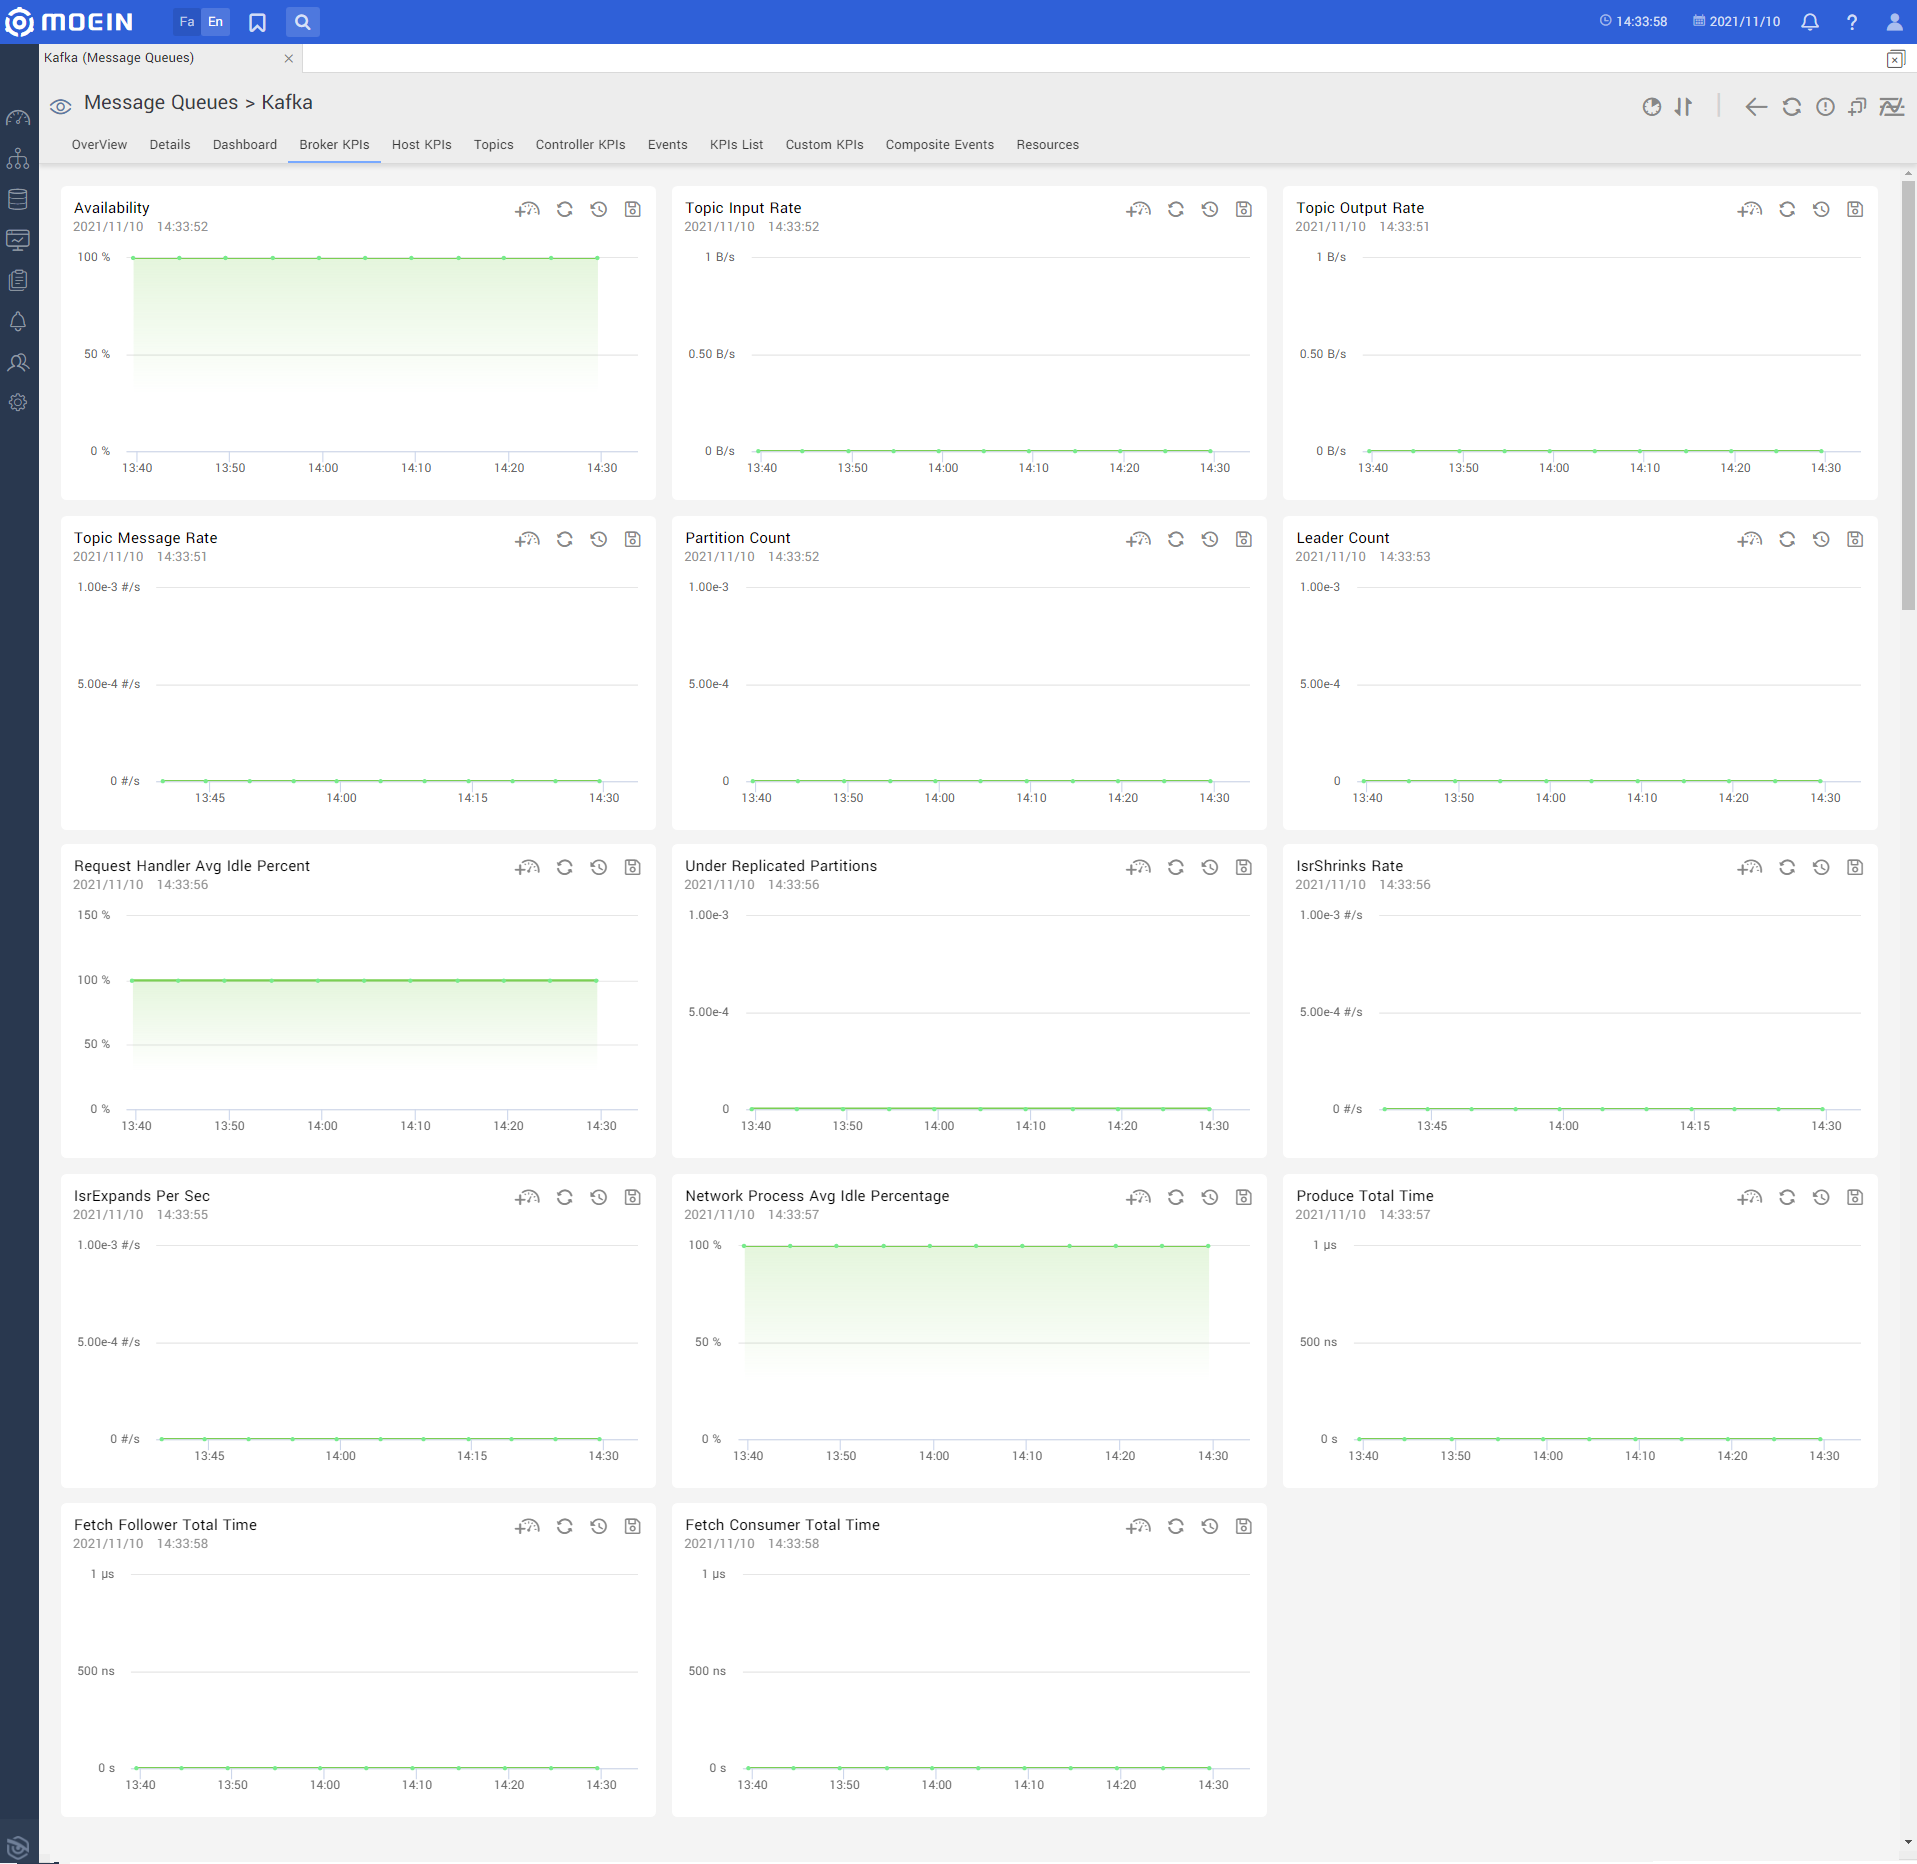
Serves:
- Under Replicated Partitions
- IsrShrinks Rate
- IsrExpands Per Sec
- Topic Input Rate
- Topic Output Rate
- Topic Message Rate
- Partition Count
- Leader Count
- Request Handler Avg Idle Percent
Network:
- Produce Total Time
- Fetch Follower Average Time
- Fetch Consumer Average Time
- Network Process Avg Idle Percentage
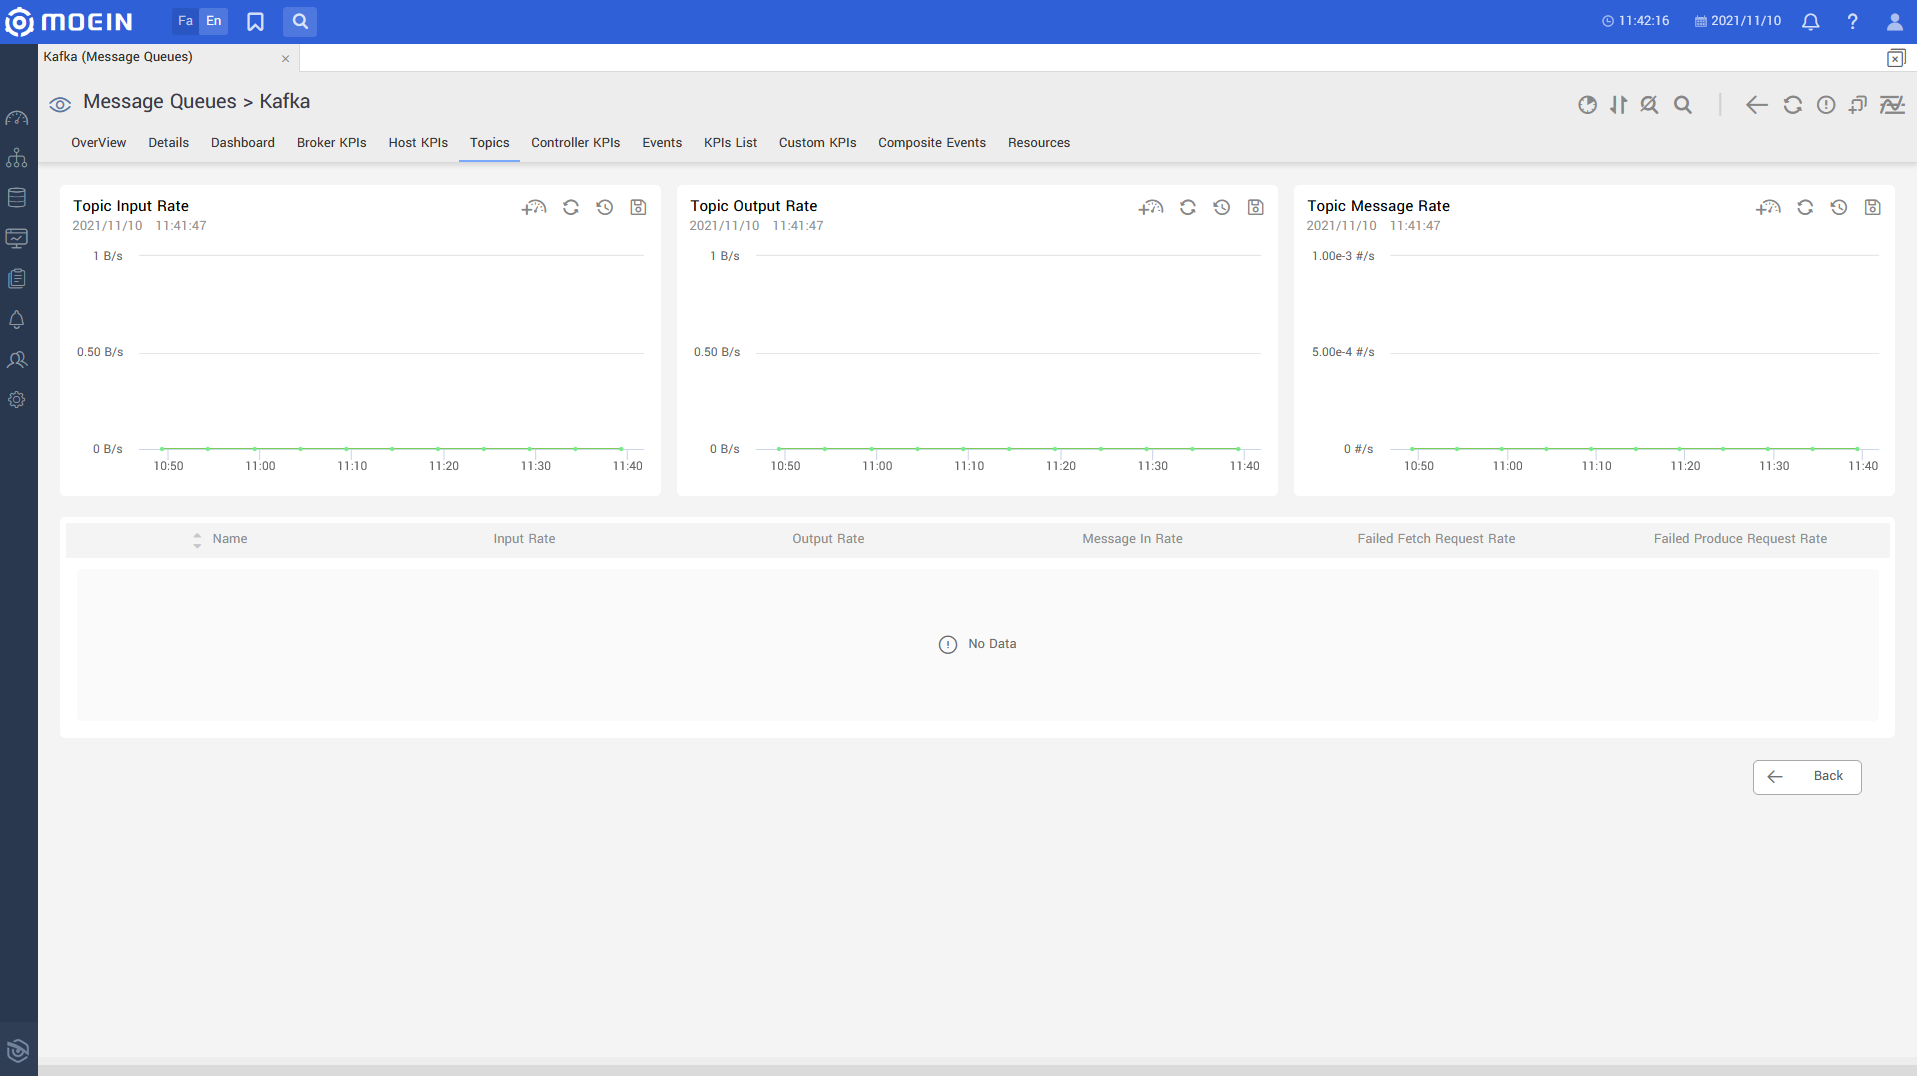
Topic:
- Input Rate
- Output Rate
- Failed Fetch Request Rate
- Failed Produce Request Rate
- Message In Rate
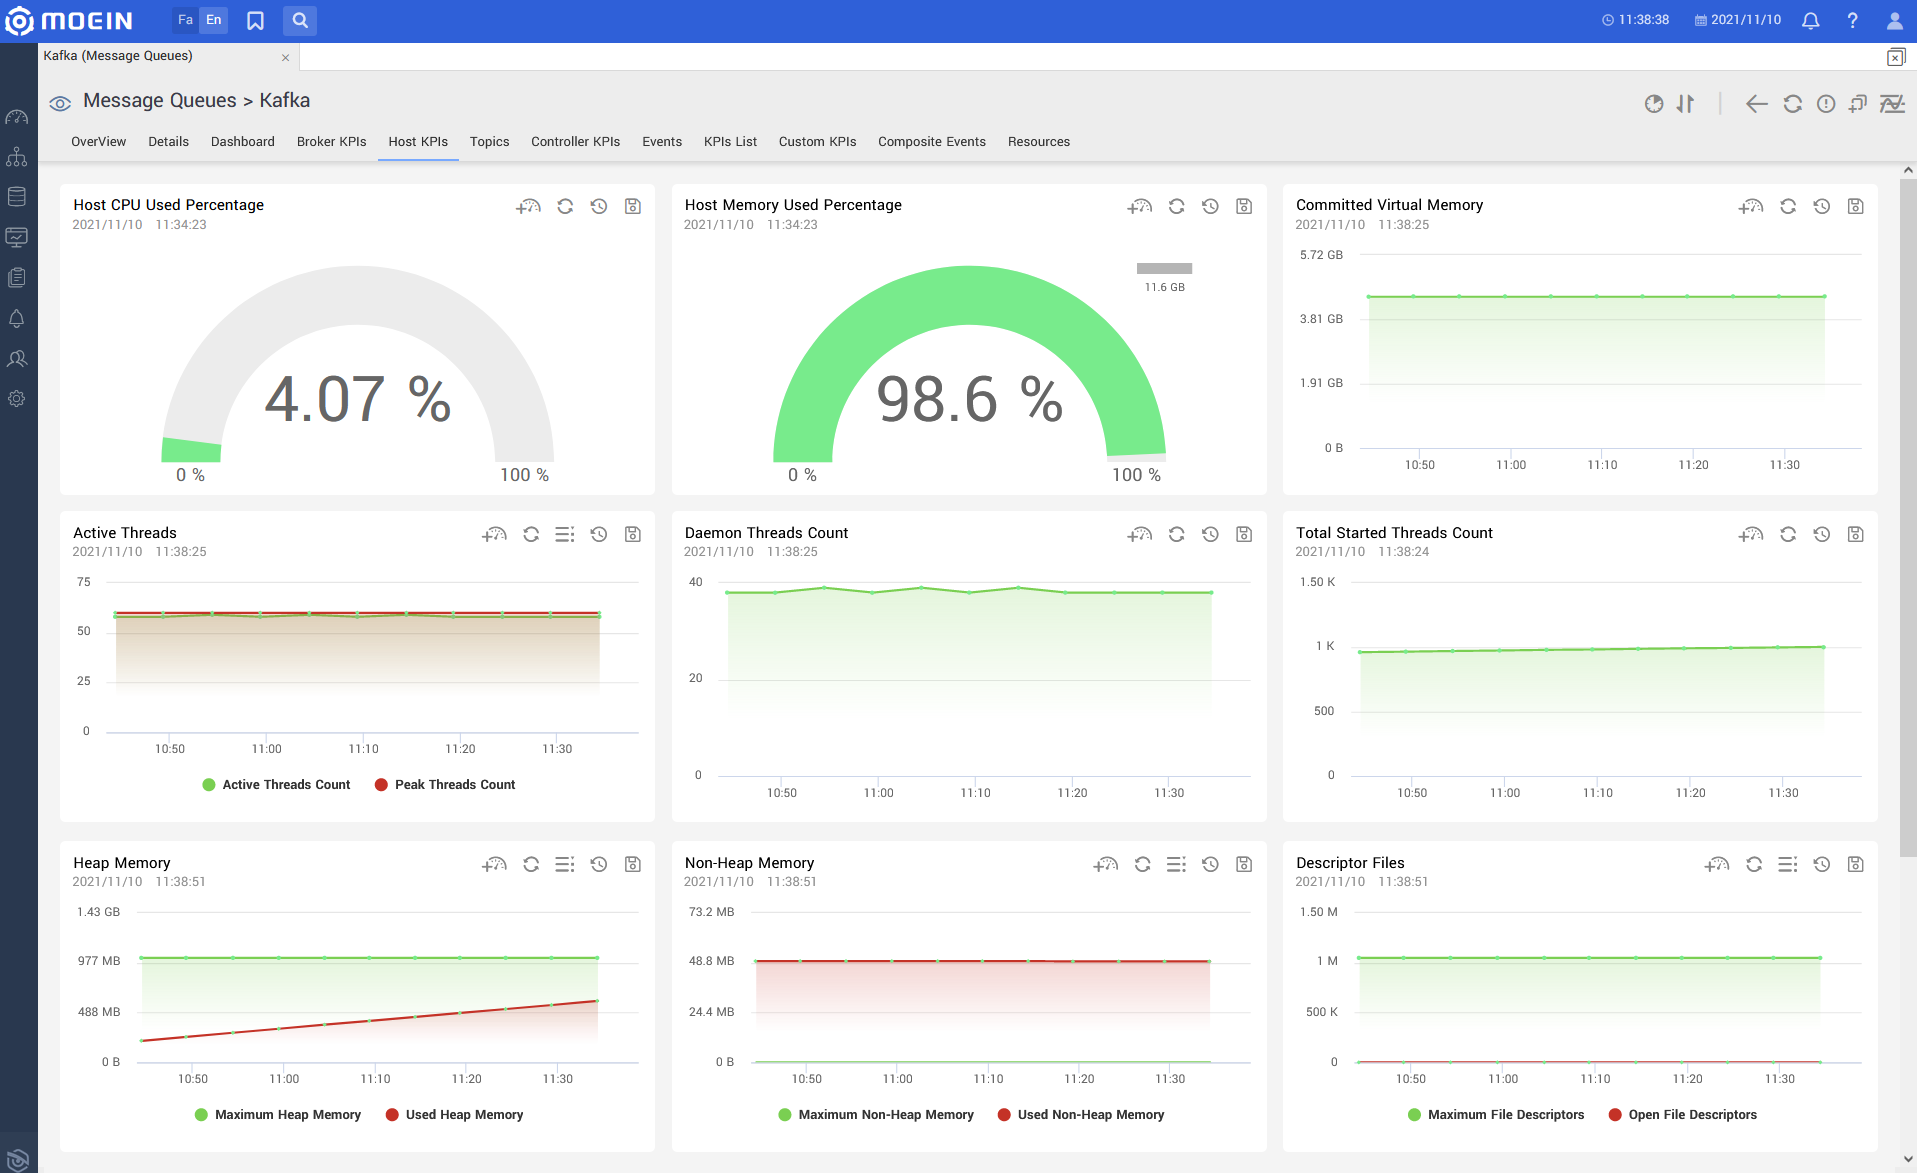
Java Host and Virtual Machine KPIs:
Host KPIs:
- Committed Virtual Memory
- Total Swap Space
- Free Swap Space Size
- Used Swap Space
- Swap Space Usage
- Host Free Memory
- Host Total Memory
- Host Used Memory
- Host Memory Used Percentage
- CPU Time
- CPU Usage
- Host CPU Usage
- Number Of Processors
- Open File Descriptors
- Maximum File Descriptors
- JVM Up Time
Threads:
- Daemon Thread Count
- Peak Thread Count
- Active Thread Count
- Total Started Thread Count
- Current Thread CPU Time
- Current Thread User Time
Memory:
- Committed Heap Memory
- Initial Heap Memory
- Maximum Heap Memory
- Used Heap Memory
- Heap Memory Used Percentage
- Committed Non-Heap Memory
- Initial Non-Heap Memory
- Maximum Non-Heap Memory
- Used Non-Heap Memory
- Non-Heap Memory Used Percentage
Java Classes:
- Total Classes
- Current Loaded Classes
- Unloaded Classes
Garbage Collectors:
- Garbage Collection Count
- Garbage Collection Rate
- Garbage Collection Time
- Average Garbage Collection Time
Communication Protocols:
- JMX
Message Queues
Behpaya Co. All rights reserved