/WebLogic Server
Application Servers
WebLogic Server Monitoring

WebLogic application server monitoring includes the following:
General WebLogic Features:
- Server Running Status
- Server Health
- Weblogic Server Uptime
- Restart Required
JVM Runtime:
- JVM Uptime
- Current Heap Size
- Heap Free Size
- Heap Free Percentage
- Process CPU Usage
- Heap Usage
- Heap Used Size
- Maximum Heap Size
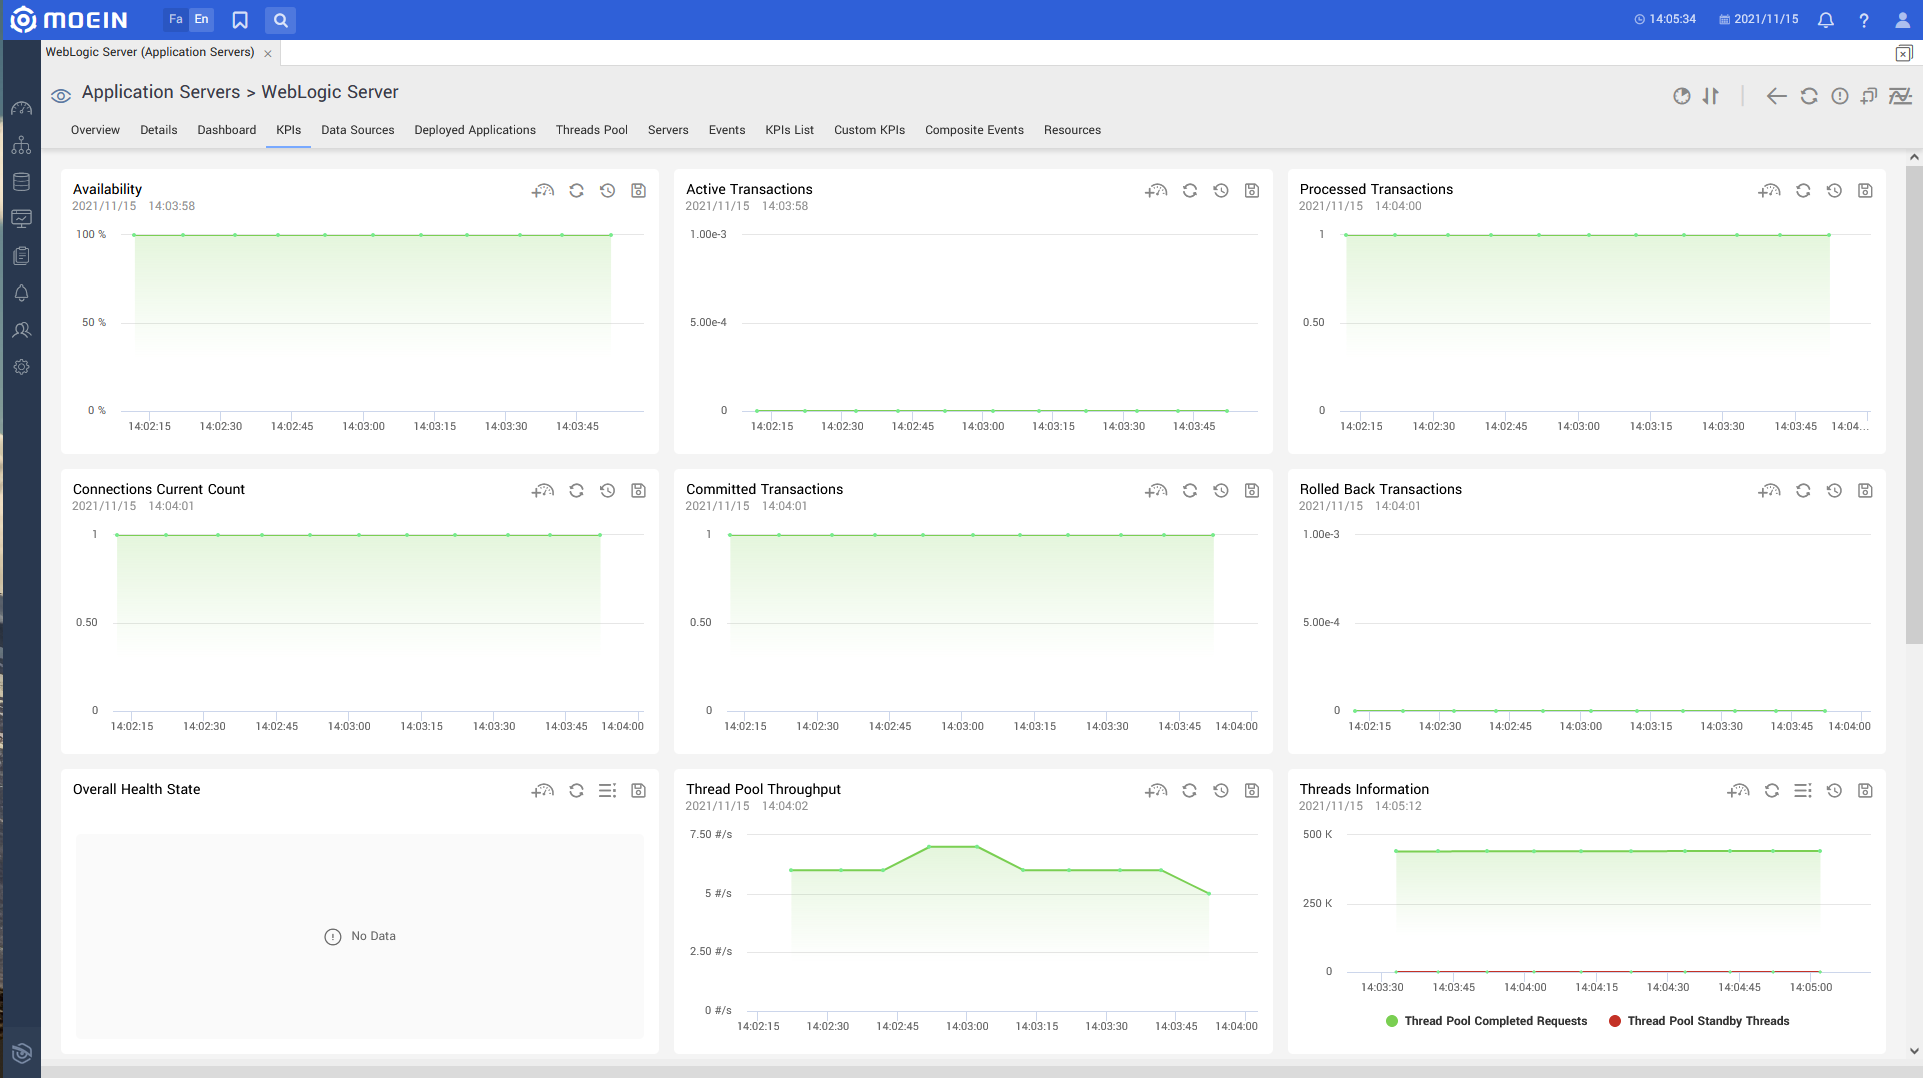
Java Transactions API:
- Rolled Back Transactions
- Committed LLR Transactions
- Transaction Total Active Time
- Processed Transactions
- Rolled Back Transactions Due To An Internal System Error
- Total Abandoned Transactions
- Two Phase Committed With TLog Transactions
- One Phase Committed Readonly Transactions
- Two Phase Committed Transactions
- Heuristics Completed Transactions
- Committed Transactions
- Active Transactions
- Rolled Back Transactions Due To A Resource Error
- Rolled Back Transactions Due To An Application Error
- Rolled Back Transactions Due To A Timeout
- One Resource And One Phase Transactions
- JTA Health
JMS:
- JMS Servers High Count
- Connections High Count
- Connections Total Count
- JMS Server Current Count
- JMS Servers Total Count
- Connections Current Count
- JMS Service Health
Class Loader Runtime:
- Loaded Class
- Class Loading Time
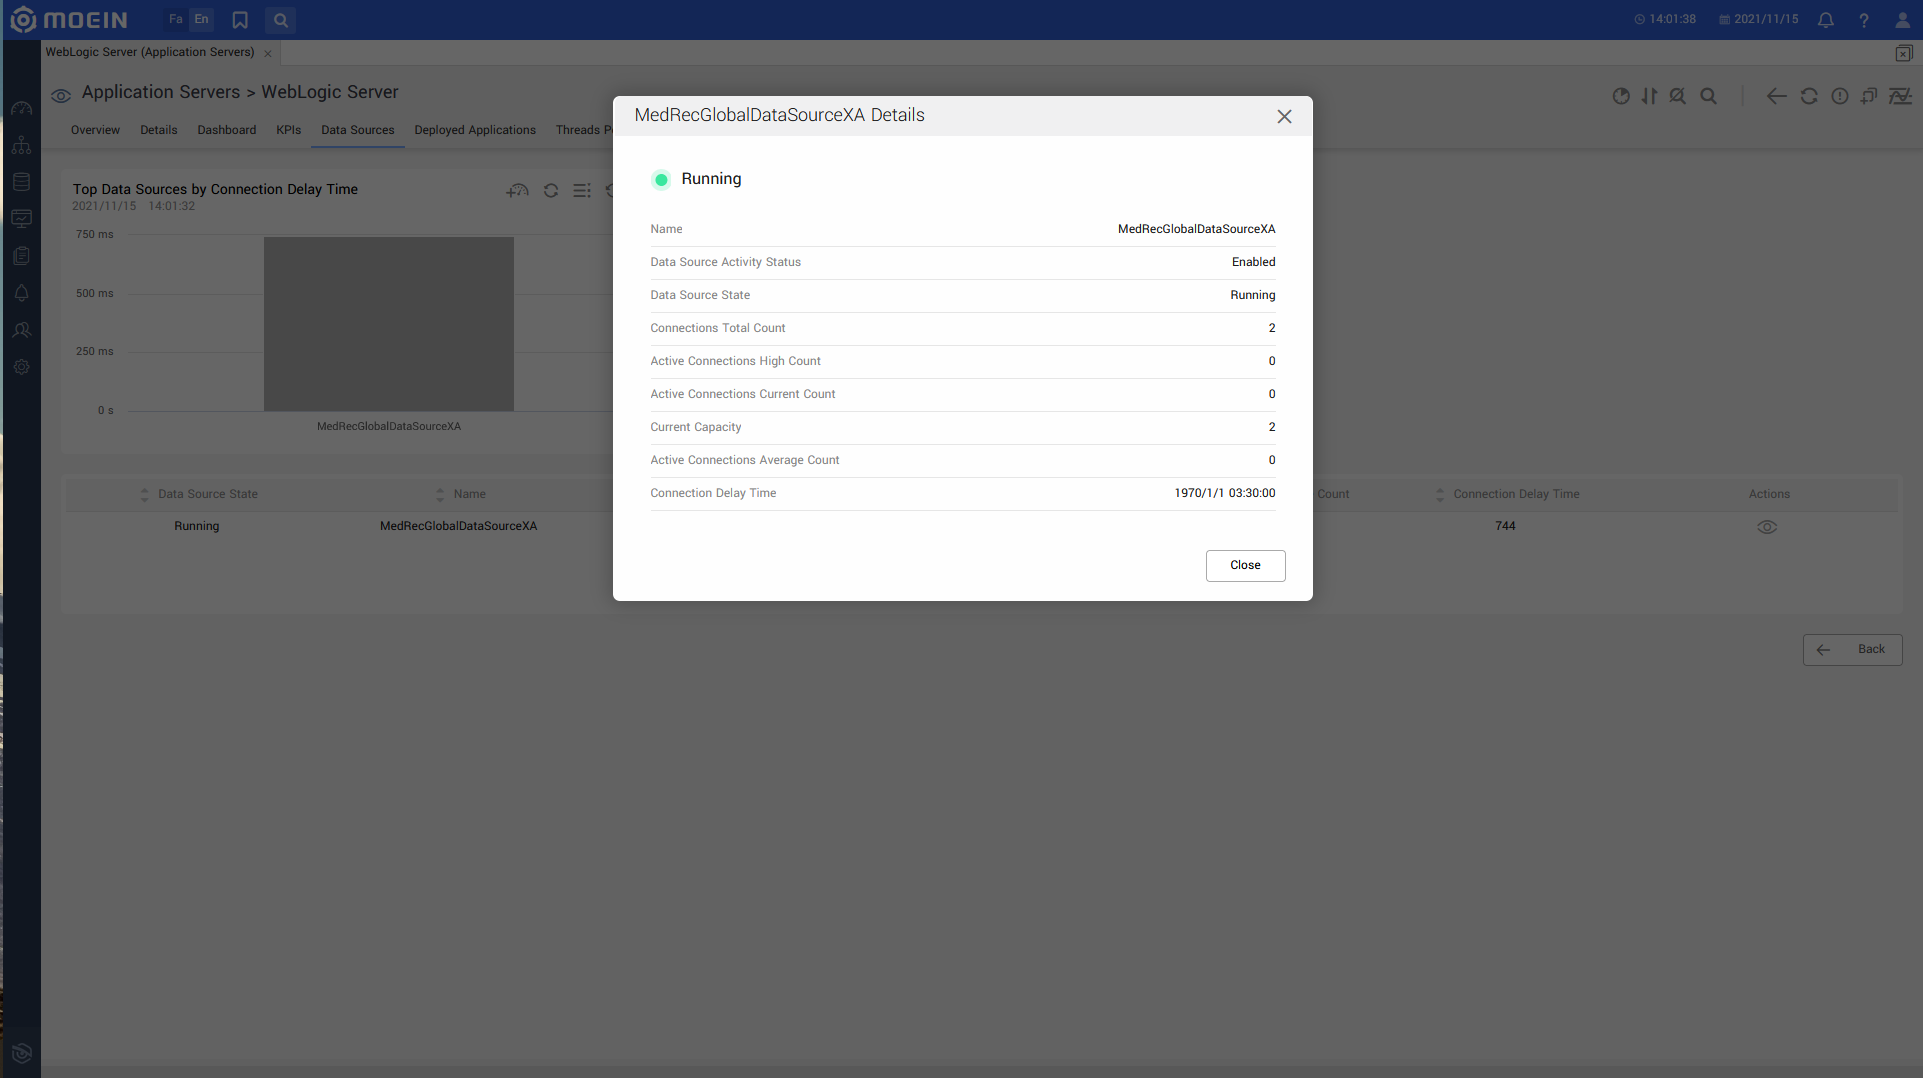
Data Source:
- Data Source Activity Status
- Data source state
- Connections Total Count
- Active Connections High Count
- Active Connections Current Count
- Current Capacity
- Active Connections Average Count
- Connection Delay Time
Deploy:
- Overall Health State
- Health State
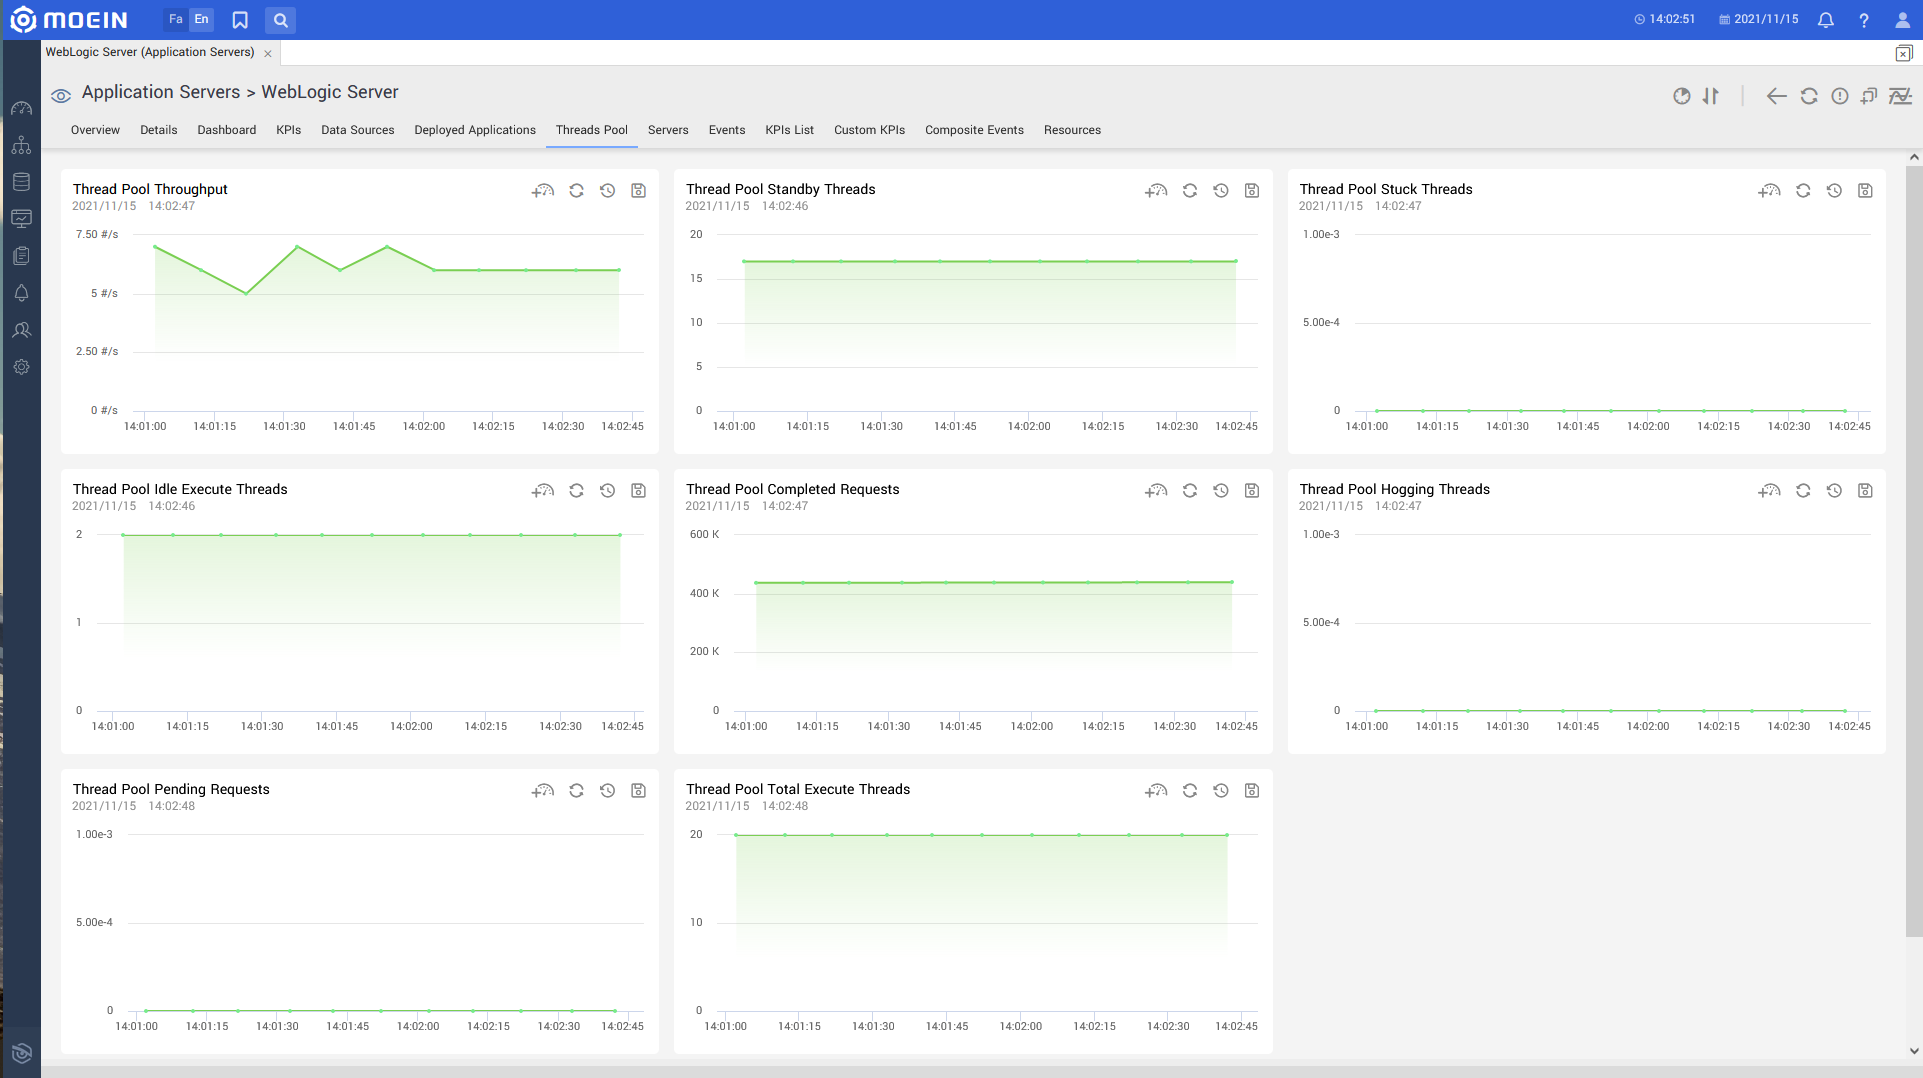
Thread:
- Thread Pool Throughput
- Thread Pool Health State
- Thread Pool Standby Threads
- Thread Pool Stuck Threads
- Thread Pool Idle Execute Threads
- Thread Pool Completed Requests
- Thread Pool Hogging Threads
- Thread Pool Pending Requests
- Thread Pool Total Execute Threads
Admin Server:
- Configured Servers In Domain
- Number Of Active HTTP Sessions
- Number Of Active Threads
- Active Server Count
Servers:
- Server Running Status
- Server Health
- Number Of Open Sockets
- Maximum Heap Size
- Current Heap Size
- Heap Free Size
- Heap Used Size
- Heap Usage
- Heap Free Percentage
Datasource:
- Data Source State
- Connections Total Count
- Active Connections High Count
- Active Connections Current Count
- Current Capacity
- Active Connections Average Count
- Connection Delay Time
- Data Source Activity Status
Cluster:
- Server State
- Server Health
- Is Master?
- Fragments Sent
- Resend Requests
- Fragments Received
Application:
- Application Running Status
- Application Health
- Application State On Target Server
- Work Manager Pending Requests
- Work Manager Completed Requests
Details of installed programs:
List of applications:
- Application Running Status
- Application Health
- Total Opened Session Count
- Open Sessions Current Count
EJB:
- Total Rolled Back Transactions
- Total Timed Out Transactions
- Total Committed Transactions
Servlet:
- Servlet Total Execution Time
- Servlet Total Invocation Count
- Servlet Total Reload Count
- Maximum Servlet Execution Time
- Minimum Servlet Execution Time
Application Servers
Behpaya Co. All rights reserved