Moein Platform/Solutions/Application Infrastructures/Application Servers/WebSphere Application Server/WebSphere Application Server
Application Servers
WebSphere Application Server Monitoring
The WebSphere Application Server is one of IBM’s most popular products in WebSphere family, used to host applications developed in Java. EJB, web container, message engine, and data sources are among the most important modules of this application server. Moein monitoring system is capable of monitoring this application server and offers a variety of performance metrics for Java Virtual Machine (JVM), threads, data sources, transactions, executed programs, servlet sessions, servlet indicators and Java messaging system. Performance indicators monitored for WebSphere application server are listed below:

Java Virtual Machine (JVM):
- CPU Usage At Last Period
- Host Free Memory
- Average CPU Usage
- Committed Heap Memory
- Maximum Heap Memory
- Heap Free Memory
- Heap Used Memory
- Heap Memory Used Percentage
- JVM CPU Usage
- JVM UP Time
Transactions:
- Total Transaction Time At Last Period
- Average Transactions Time
- Total Local Transactions Time
- Total Committed Transactions Time
- Committed Transactions
- Average Committed Transactions Time
- Local Committed Transactions
- Local Committed Transactions Rate
- Rolled Back Transactions
- Rolled Back Transactions Rate
- Local Rolled Back Transactions
- Local Rolled Back Transactions Rate
- Timeout Transactions
- Local Timeout Transactions
- Total Transactions
- Total Transaction Rate
- Committed Transactions Rate
- Active Transactions
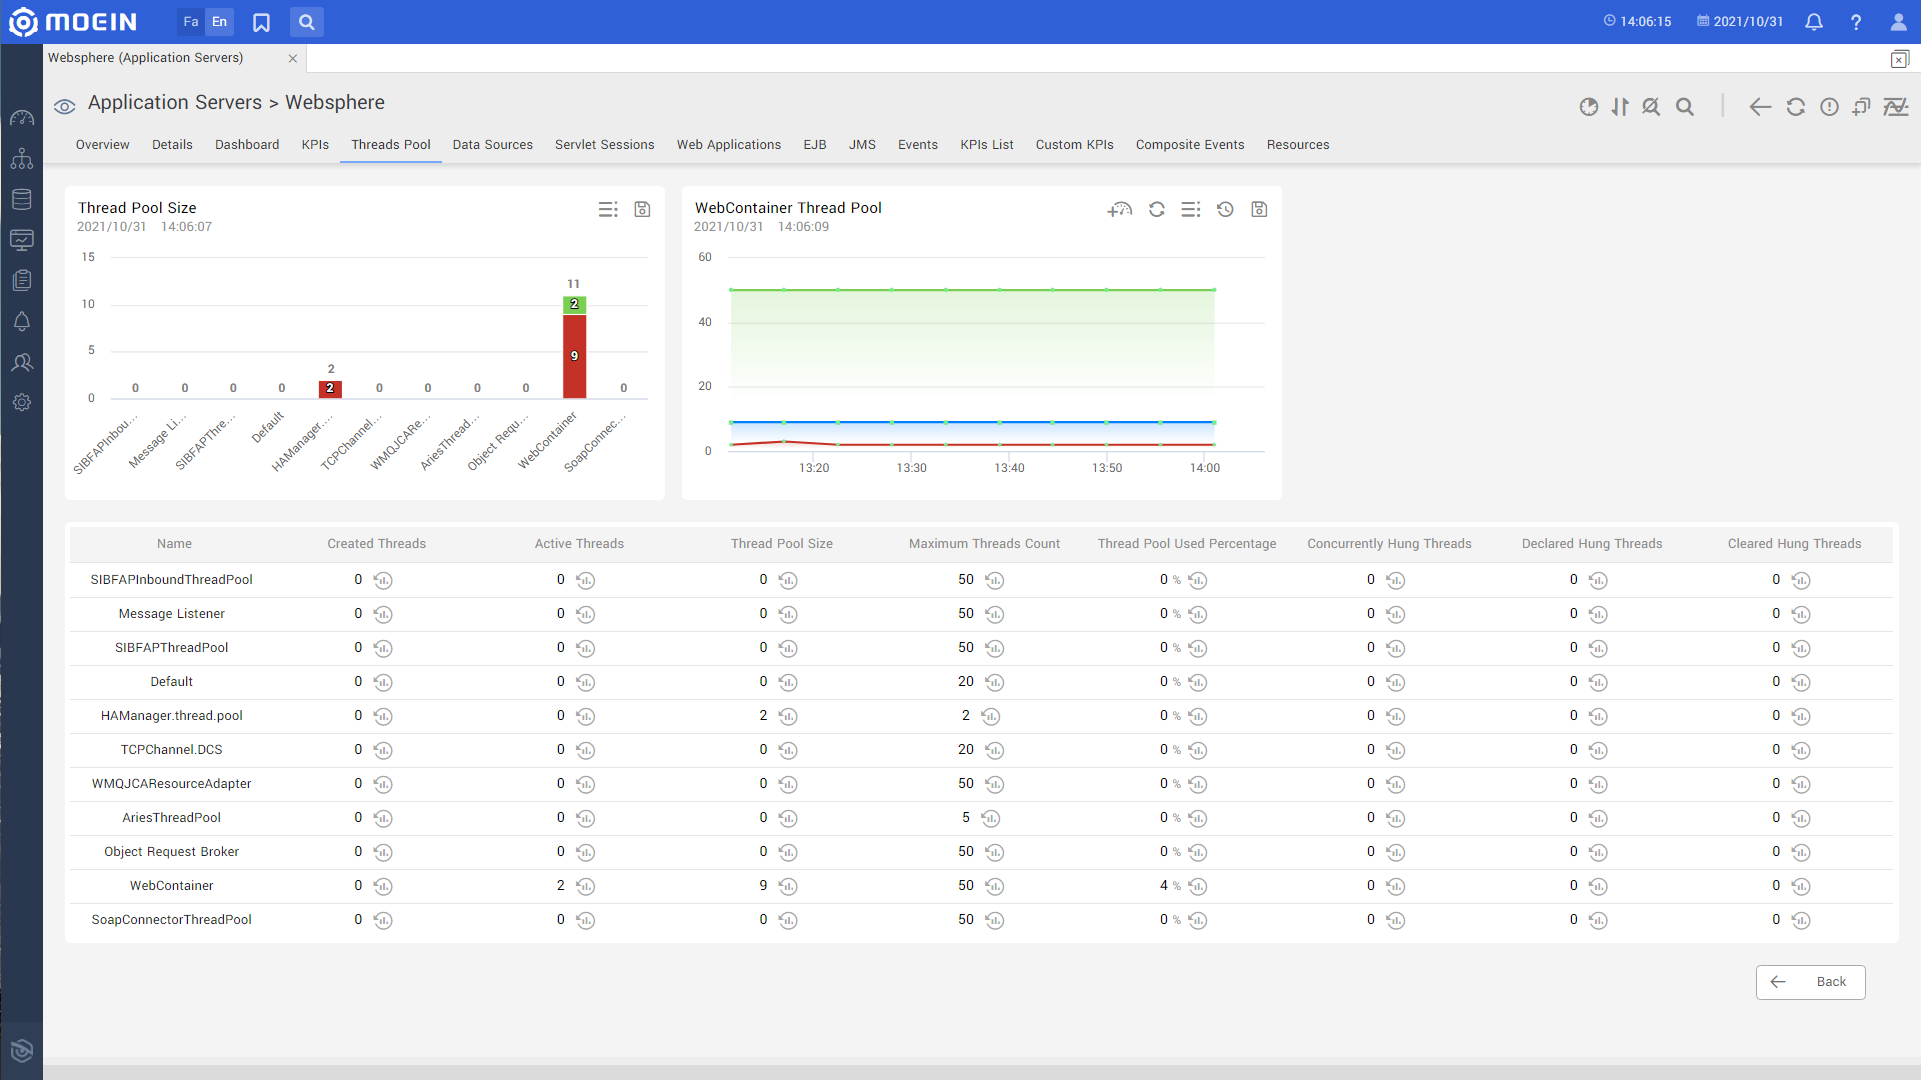
Thread Pools:
- List of Thread Pools
- Created Threads
- Destroyed Threads
- Active Threads
- Maximum Size Of Thread Pool
- Concurrently Hung Threads
- Declared Hung Threads
- Cleared Hung Threads
- Thread Pool Size
- Thread Pool Used Percentage
Data Source:
- List Of Data Sources
- Type
- Connections Allocation Rate
- Maximum Pool Size
- Free Pool Size
- PercentUsed Value
- Number Of Waiting Thread
- Wait Time
- Total Use Time
- Average Connection Use Time
- Average Of Total Connection Use Time
- Number Of Allocated Connections In Last Period
- Number Of Created Connections
- Total Number Of Created Connections
- JDBC Average Connection Use Time
- Average Of JDBC Total Connection Use Time
- Connection Pool Used Percentage
- Connection Pool Size

Servlet Sessions:
- List Of Applications
- Application Name
- Session Creation Rate
- Affinity Break Rate
- Live Sessions
- Active Sessions
- Session Creation Count At Last Period
- Total Number Of Affinity Breaks At Last Period
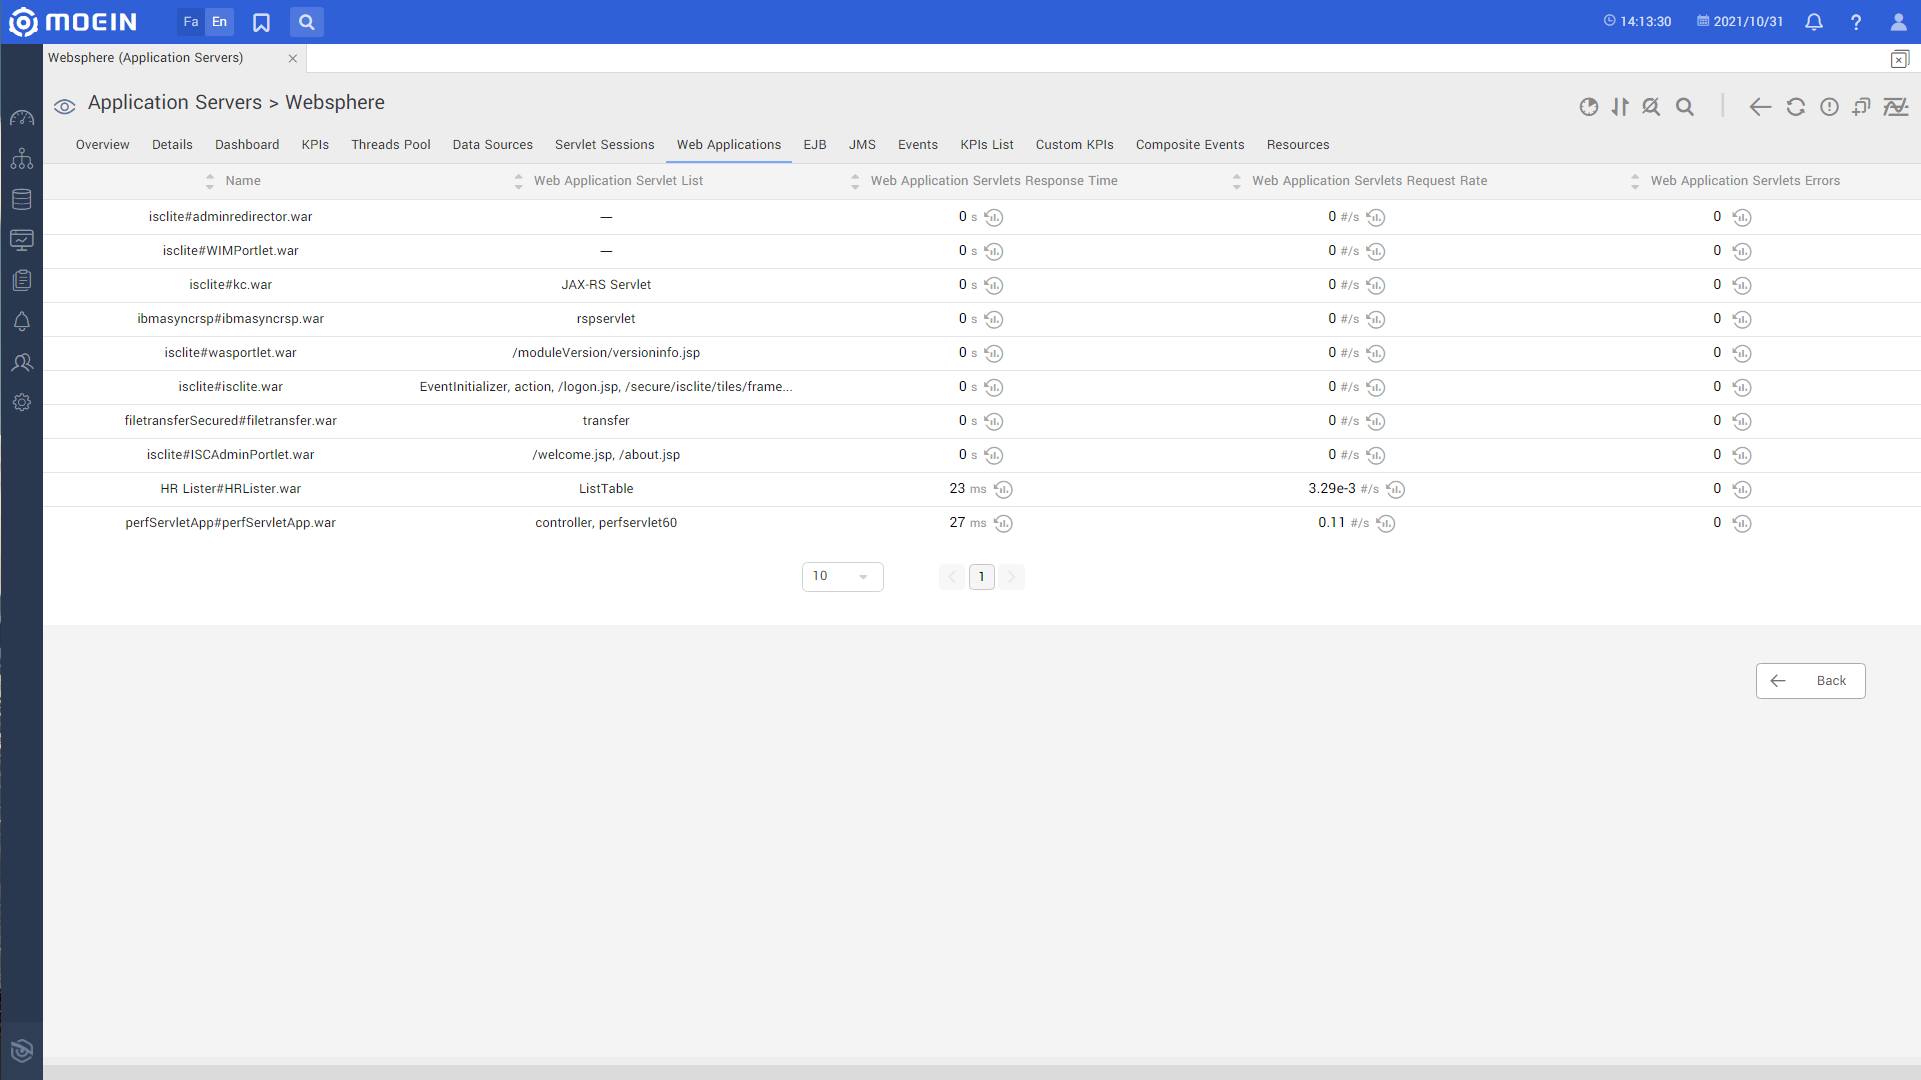
WEB Service Servlets:
- List Of Web Applications
- Web Application Name
- Web Application Servlets List
- Web Application Servlets Response Time
- Web Application Servlets Request Rate
- Web Application Servlets Errors
EJBs:
- List Of EJBs
- EJB Name
- EJB Type
- Live Beans
- Total Methods Calls
- Total Methods Response Time
- Average Of Total Methods Response Time
- Average Methods Response Time
- Average Methods Call Rate
JMS Queues:
- List Of JMS Queues
- Queue Name
- Queue Length
- Uncommitted Message
- Input Message Rate
- Consumed Message Rate
- Number Of Local Producers
- Number Of Local Consumers
- Average Message Wait Time
- Oldest Message Age
JMS Topics:
- List Of JMS Topics
- Topic Name
- Number Of Durable Subscriptions
- Number Of Non Durable Subscriptions
- Incomplete Publications
- Oldest Publication Age
- Publishers Count
- Total Local Subscriptions Count
- Total Messages Published Count
- Total Local Subscriptions Hit Count
- Messages Publish Rate
Communication Protocols:
- REST
Application Servers
Behpaya Co. All rights reserved