
Dissecting ManageEngine (Part Four): Islands of Information Blindness; Why Finding the Root Cause Becomes Difficult in Multi-Module Environments

Before entering the discussion, it is necessary to emphasize that the goal of this series of articles is not to question the value or capability of the prominent IT infrastructure monitoring tools. Many of these solutions have been used in various organizations for years and play an important role in monitoring and managing IT environments. What is examined in this series of articles is more of an analytical look at some limitations and challenges that can become problematic for organizations. Therefore, if you intend to purchase ManageEngine software, we suggest that before making a decision, you also study the series of articles on dissecting ManageEngine.
In many operational crises, the primary problem is not a lack of data; quite the opposite—there is too much of it. The network generates alerts, applications generate alerts, logs are filled with errors, and the monitoring platform produces dozens of different signals. Yet despite all this information, the operations team is still confronted with one simple question:
"Where did the problem actually begin?"
At moments like these, many teams realize that their monitoring platform does not provide a unified view of the system. Instead, it presents a collection of separate dashboards, each showing only a portion of reality. This is precisely where the concept of "islands of information blindness" emerges.
In Part Two of our ManageEngine series, we saw that despite its seemingly unified appearance, the platform suffers from what can be described as an illusion of integration. One of the most significant consequences of this architecture is the increasing difficulty of identifying the root cause of incidents during operational crises.
When ManageEngine is deployed in a real-world infrastructure, operations teams quickly encounter a serious architectural gap: the monitoring data exists, but it is stored and analyzed in separate islands.
How Does ManageEngine Behave in Complex Infrastructures?
To better understand the impact of this multi-module architecture, let us examine two different scenarios.
Scenario One: A Simple Problem Within a Single Layer
Suppose an application server experiences a sudden spike in CPU utilization. As a result, the service begins to respond slowly.
In this situation, Applications Manager quickly detects the abnormal resource consumption and generates an alert. By examining that module alone, the operations team can determine that the issue originates from unusually high CPU usage on that particular server.
In such a scenario, the multi-module nature of the system does not create a significant problem. The source of the incident resides within the same layer that generated the alert, allowing the operations engineer to identify the cause relatively quickly.However, not all incidents are this straightforward.
Scenario Two: An Incident That Propagates Across Multiple Layers
Now consider a more complex scenario.
Users report that a financial service has become extremely slow.
Within ManageEngine, the following events occur simultaneously:
- OpManager reports increased network latency.
- Applications Manager detects reduced application throughput.
- NetFlow Analyzer shows an abnormal increase in traffic along a particular network path.
- Log360 records multiple timeout errors in the service logs.
At this point, the platform contains a considerable amount of information, yet each module sees only a portion of the overall picture.
There is no deeply integrated analytical engine capable of bringing these events together into a shared operational model—an engine that can determine which event is the root cause and which events are merely consequences of that failure. As a result, the operations team is confronted not with a single meaningful alert but with multiple scattered signals. Engineers must manually move between different dashboards in order to reconstruct the complete picture.
In ManageEngine's island-based architecture, valuable time is spent switching between tabs and dashboards. The direct consequence is a significant increase in Mean Time to Resolution (MTTR) and, ultimately, user dissatisfaction. During critical moments, when every second matters to the business, delegating root-cause discovery to the assumptions and intuition of a stressed engineer becomes one of the organization's greatest operational risks.
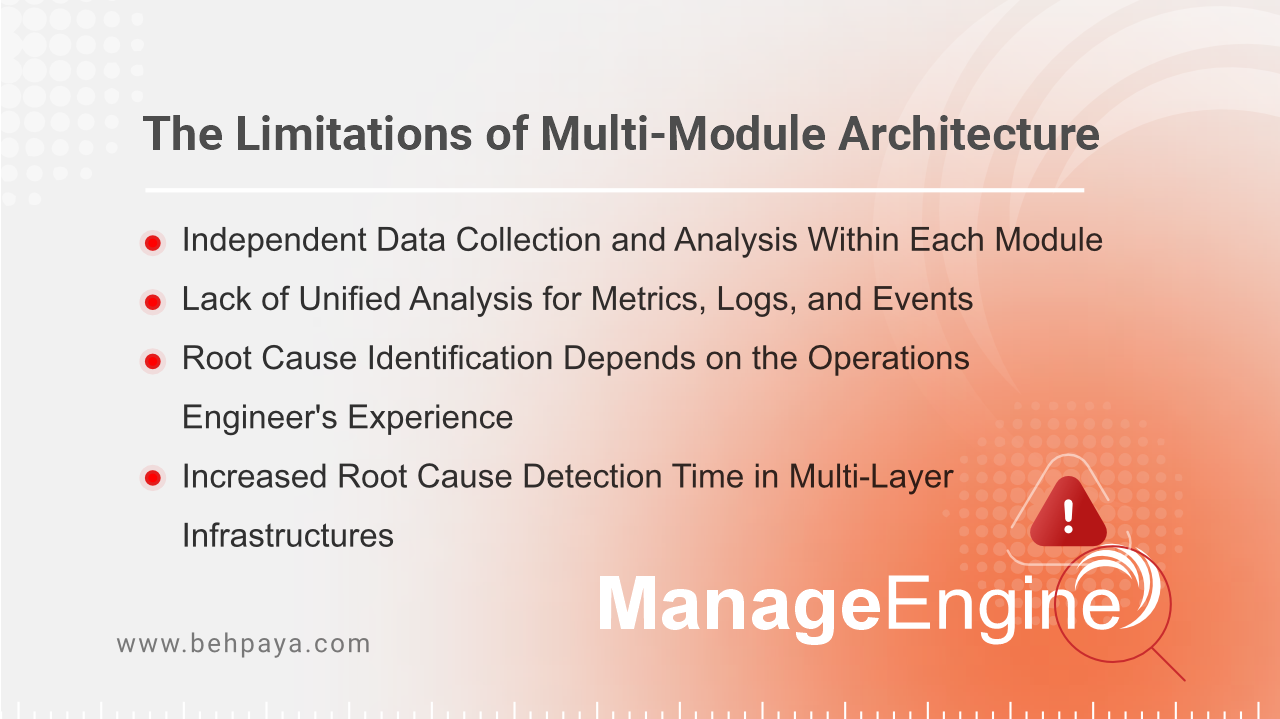
The Limitations of a Multi-Module Architecture
Scenarios like the second example reveal the true limitations of this architectural model.
The fundamental problem is not the absence of data. The data exists. The issue is that the data is not analyzed within a common operational model.
When every module independently collects information, processes data, and generates alerts, the platform effectively becomes a collection of separate tools. Under these conditions, event correlation, service dependency analysis, and root-cause identification depend more on the experience of the operations engineer than on the capabilities of the platform itself.
If the infrastructure is simple and consists of only a single layer, this limitation may not be particularly noticeable. However, in environments where services span multiple layers—from networking and infrastructure to applications and databases—this architectural gap can significantly increase both the time required to diagnose incidents and the time required to resolve them. For this reason, many modern observability platforms have attempted to solve the problem at the architectural level. Rather than relying on multiple independent modules, these platforms analyze all system signals—including metrics, logs, and events—within a shared data core.
A Unified Data Approach
Moein Monitoring Platform has been designed around this same principle.

Within this architecture, data originating from different layers of the infrastructure—from server and network metrics to logs and application events—is collected and analyzed within a common data core instead of being maintained inside separate modules.
This level of integration enables the platform to better understand the relationships between different events.
For example, it can identify how increased network latency may lead to application performance degradation and eventually generate errors within service logs.
As a result, instead of presenting operators with a collection of isolated alerts, the path toward identifying the root cause becomes significantly shorter and more transparent.
Series of Articles on Dissecting ManageEngine




The Latest Articles
