
Dissecting Zabbix (Part Four): Hidden Complexity: Why Real-World Zabbix Deployments Take Much Longer Than Expected

Before entering the discussion, it is necessary to emphasize that the goal of this series of articles is not to question the value or capability of the prominent IT infrastructure monitoring tools. Many of these solutions have been used in various organizations for years and play an important role in monitoring and managing IT environments. What is examined in this series of articles is more of an analytical look at some limitations and challenges that can become problematic for organizations. Therefore, if you intend to purchase Zabbix software, we suggest that before making a decision, you also study the series of articles on dissecting Zabbix.
Before diving into the discussion, it is important to understand the concept of Time-to-Value (TTV) in IT software. Time-to-Value refers to the period required for a solution to move beyond installation and become operationally useful, delivering measurable value to an organization.
In monitoring platforms, this process typically includes tasks such as onboarding infrastructure assets and services, configuring monitoring templates, defining alert thresholds, establishing notification workflows, and building dashboards that provide meaningful operational visibility.
Zabbix presents an interesting paradox. Installing the core platform may take only a few minutes, yet achieving meaningful operational value in a medium-sized or large enterprise environment can take months. The question is: why does the path from installation to operational readiness become so lengthy and resource-intensive?
The Endless Cycle of Templates and Manual Configuration
One of the primary reasons lies in the way Zabbix handles templates and discovery processes. Although the Zabbix community provides a large collection of free templates, few of them are fully suitable for real-world enterprise environments without modification.
Administrators are often required to review existing templates, remove unnecessary metrics, add missing monitoring logic, adjust discovery rules, and in many cases build entirely new templates from scratch.
The challenge does not end after deployment. Templates require continuous maintenance as infrastructure evolves. Changes in network topology, operating system upgrades, application updates, and modifications to discovery mechanisms can all require ongoing adjustments to discovery rules and Low-Level Discovery (LLD) configurations.
As a result, monitoring teams frequently find themselves trapped in a continuous cycle of modification, testing, and redesign. This ongoing effort directly delays the point at which the monitoring system becomes fully operational and trusted by the organization.
The Dashboard-Building Challenge
A second challenge emerges in the visualization layer.
While Zabbix includes dashboard capabilities, its design is fundamentally infrastructure-oriented rather than service-oriented. Organizations that need visibility into business services—such as payment platforms, email systems, customer-facing applications, or critical operational workflows—do not receive ready-made service monitoring views out of the box.
Instead, teams must manually create widgets, configure graphs, define relationships between monitored components, and assemble dashboards that represent service behavior.
More importantly, these dashboards do not automatically adapt to infrastructure changes. A modification to an application architecture, service endpoint, or deployment model can quickly make existing dashboards inaccurate or incomplete.
In many organizations, dashboard development and maintenance alone can consume weeks of effort before stakeholders gain the operational visibility they actually need.
Manual Threshold Tuning and Alert Routing
Perhaps the most challenging phase is configuring alert thresholds and notification logic.
No organization can rely on a monitoring platform unless its alerts are accurate, timely, and free from excessive noise. However, Zabbix's default thresholds rarely align with the operational realities of a specific environment. This frequently results in large numbers of false-positive alerts.
Consequently, administrators often spend days or weeks adjusting macros, refining alert rules, customizing escalation policies, and integrating media types with organization-specific notification workflows.
Until these configurations are carefully calibrated and proven reliable, operations teams cannot fully trust the alerts generated by the platform. From a practical perspective, monitoring cannot be considered truly operational until that trust has been established.
An Infrastructure-Centric Data Model in a Service-Centric World
Another important challenge receives far less attention: the underlying data model.
Zabbix is fundamentally designed around an infrastructure-centric approach. Its monitoring model focuses on individual infrastructure components such as CPU utilization, memory consumption, disk usage, network interfaces, and running processes.
Modern organizations, however, increasingly need to monitor services rather than individual infrastructure elements.
When a payment service experiences performance degradation, for example, stakeholders are rarely concerned with which virtual machine consumed additional memory. What matters is identifying where the service failure originated and understanding its impact on business operations.
Zabbix does not provide a native service-centric model capable of representing these relationships by default. As a result, organizations are often forced to manually design service models, dependency structures, service-level objectives (SLOs), and service-level agreements (SLAs).
This process is both time-consuming and highly susceptible to human error.
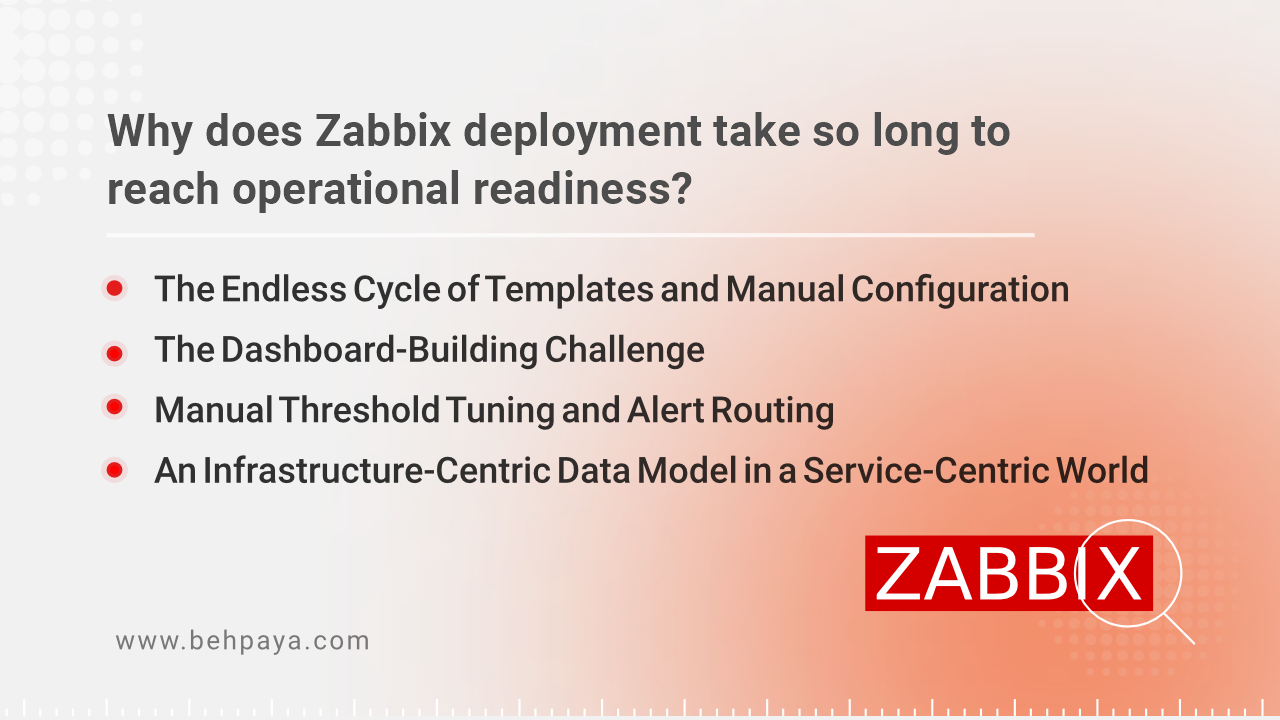
Conclusion: The Dangerous Gap Between Installation and Value
When these four challenges are considered together, a clear pattern emerges: the Time-to-Value of a Zabbix deployment is often significantly longer than organizations initially expect.
During this extended period, organizations may still lack comprehensive visibility into their infrastructure, receive unreliable or incomplete alerts, and remain dependent on supplementary tools or human expertise to identify and troubleshoot incidents.

The key point is that the value of a monitoring platform is not determined solely by the number of features listed in a product comparison. Equally important is how quickly the platform can become operationally useful and begin delivering meaningful outcomes.
Many open-source monitoring solutions, including Zabbix, provide strong foundational capabilities. However, the journey from installation to operational value can be considerably longer than anticipated.
By contrast, integrated and intelligent monitoring platforms such as Moein Monitoring Platform aim to shorten this path through automated discovery processes, simplified service modeling, ready-to-use operational dashboards, and intelligent alert calibration mechanisms.
Ultimately, organizations should not evaluate monitoring solutions based solely on the perception of being "free" or low-cost. A more important question for IT decision-makers is:
How quickly can this platform begin delivering real operational value to my organization?
This is often where the distinction between a highly customizable open-source monitoring tool and a fully integrated monitoring platform becomes most apparent.
Series of Articles on Dissecting Zabbix




The Latest Articles
