Runtime Environments
JVM Monitoring
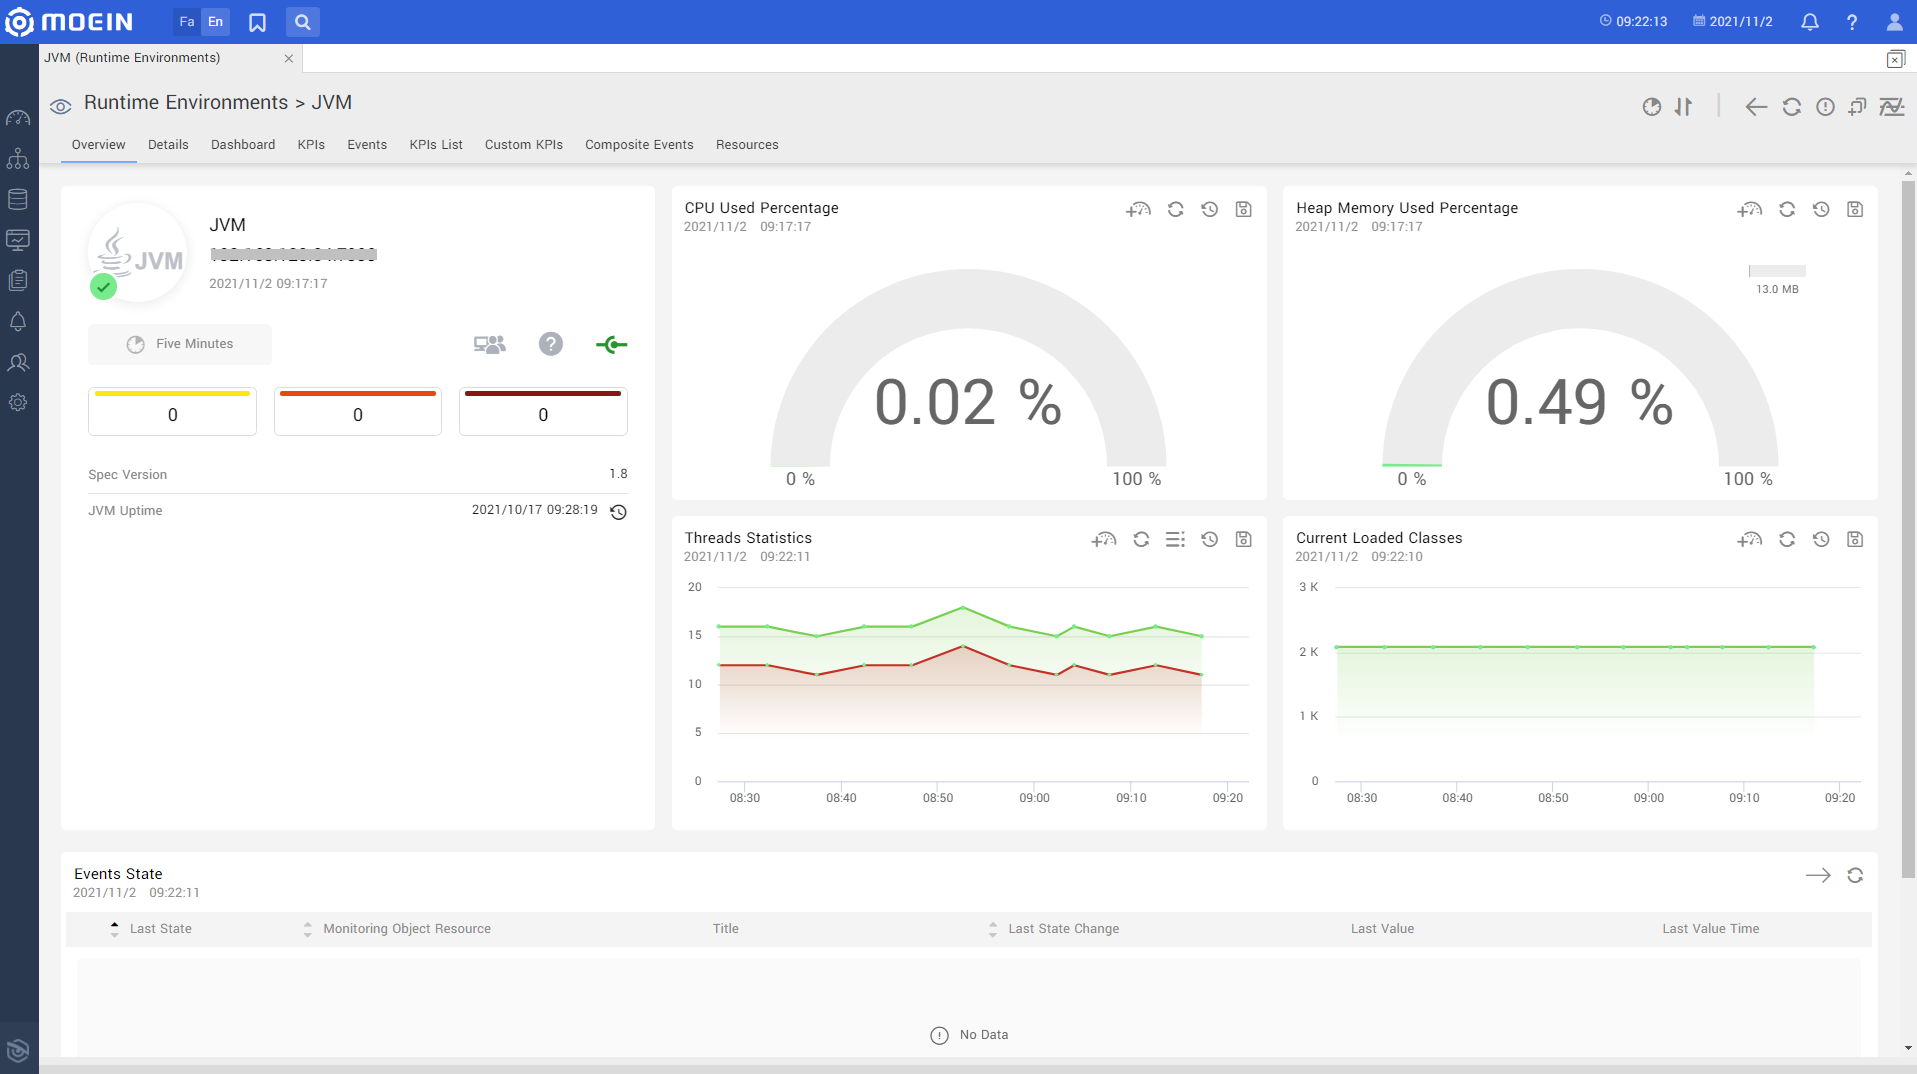
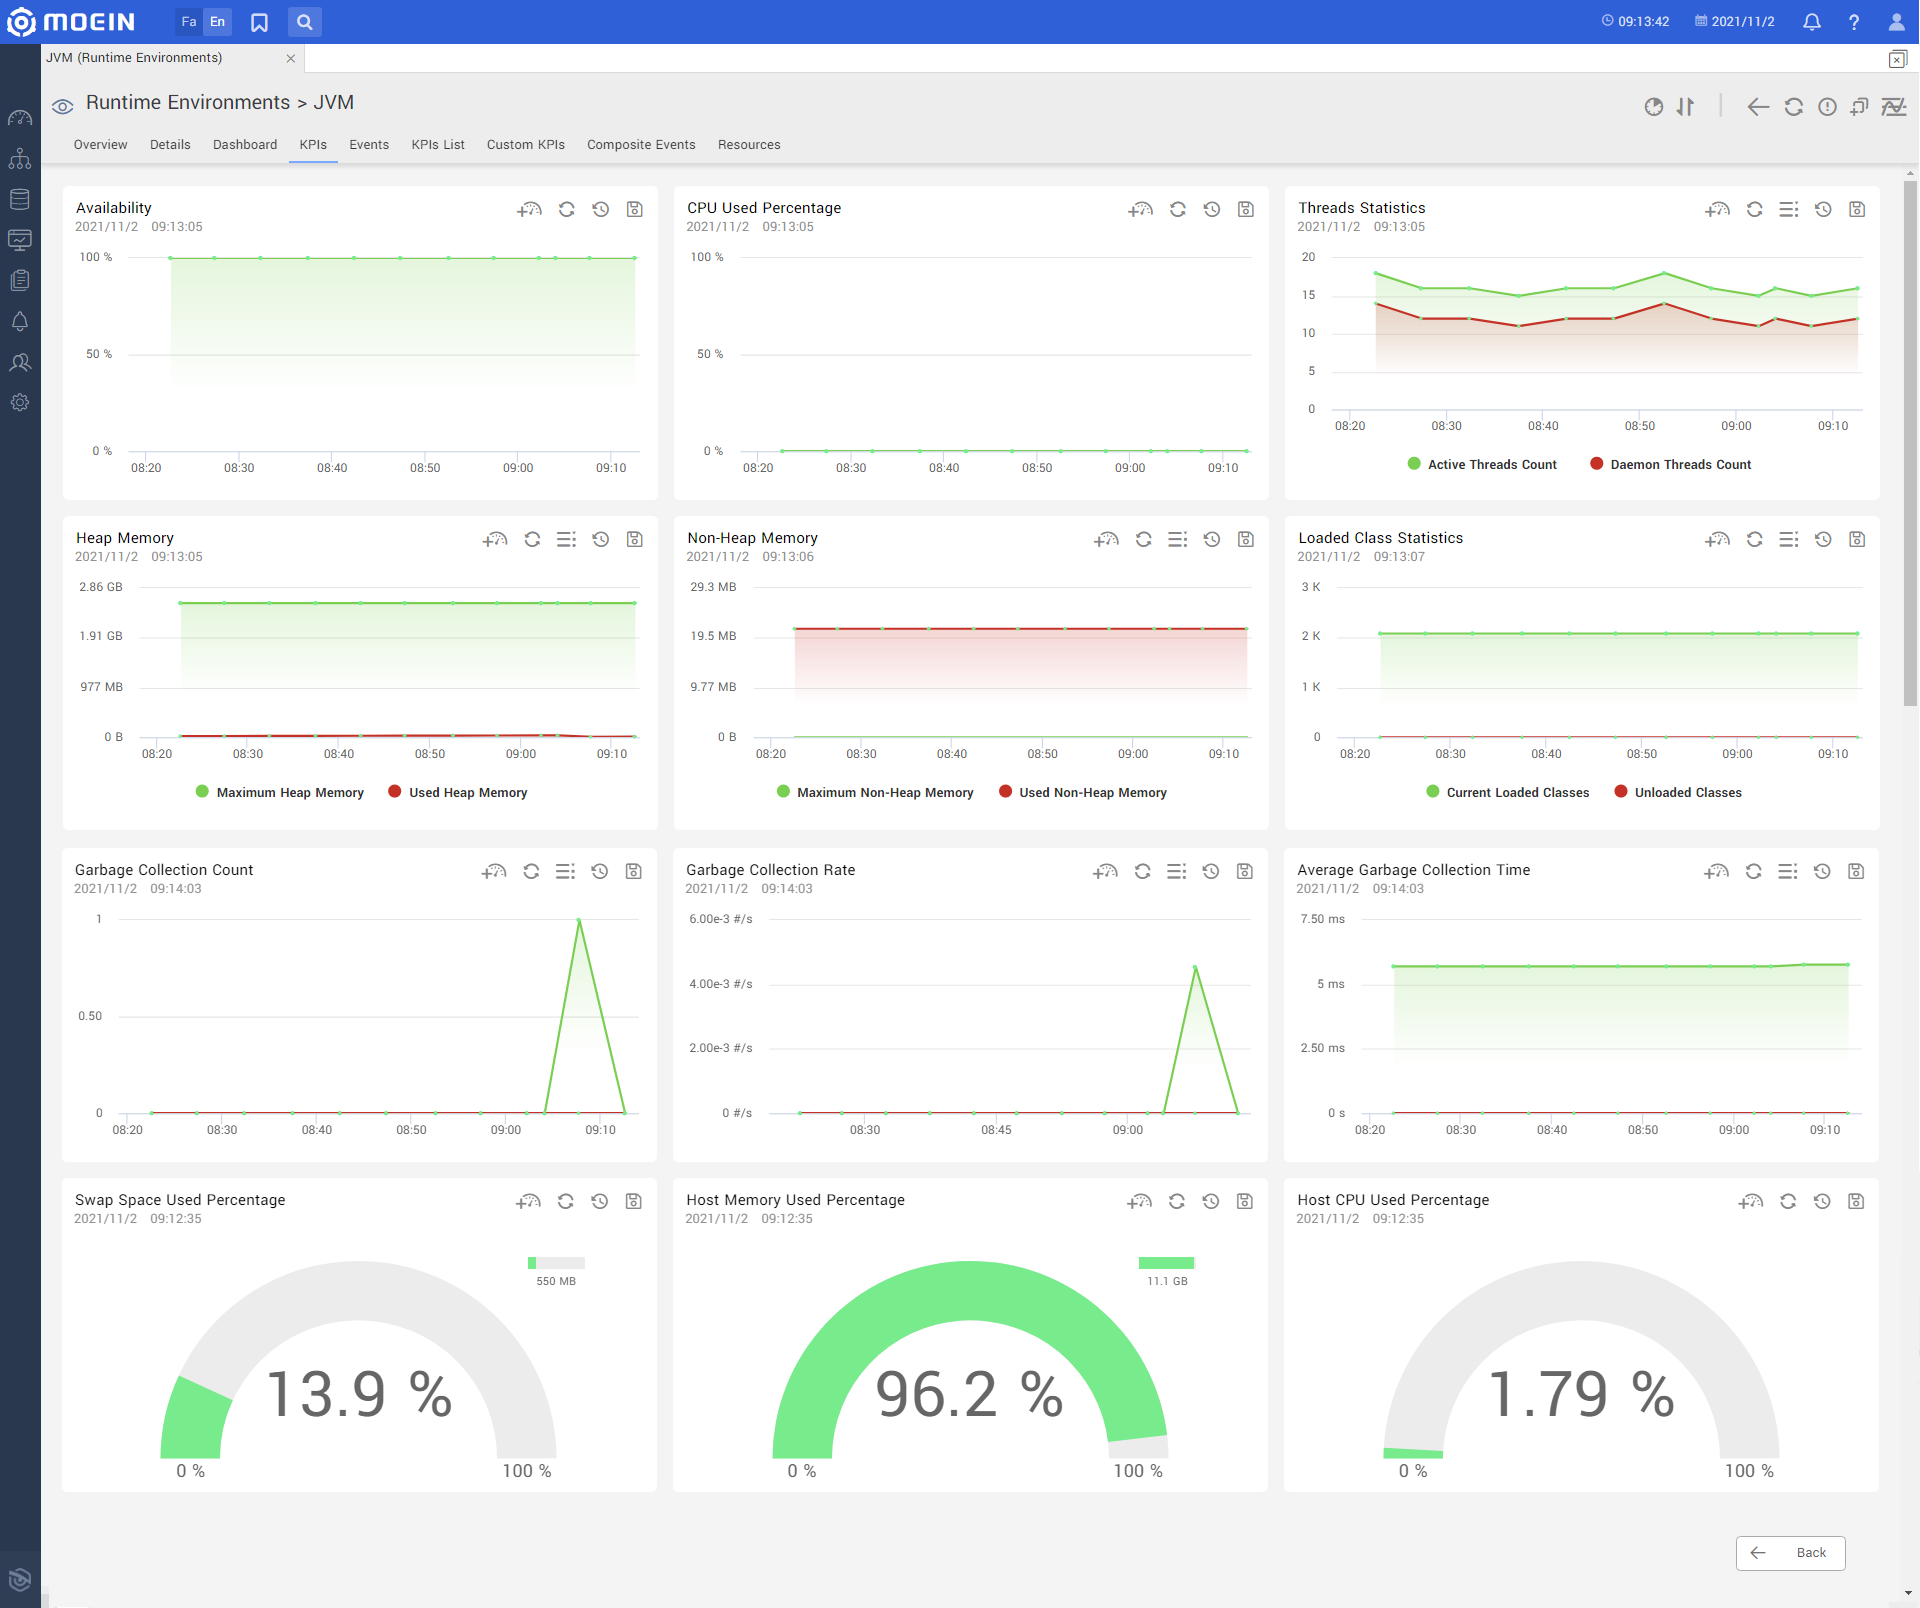
Java is currently one of the most widely used enterprise and mid-level application development languages, using the Java Virtual Machine (JVM) as the execution environment. Monitoring JVM-related performance indicators such as JVM CPU usage, Heap and Non-Heap memory, Garbage Collectors indicators, Threads are very important for development teams and administrators. Moein monitoring system has the ability to monitor these JVM performance indicators, which are listed below:
Host KPIs:
- Committed Virtual Memory
- Total Swap Space
- Free Swap Space Size
- Used Swap Space
- Swap Space Usage
- Host Free Memory
- Host Total Memory
- Host Used Memory
- Host Memory Used Percentage
- CPU Time
- CPU Usage
- Host CPU Usage
- Number Of Processors
- Open File Descriptors
- Maximum File Descriptors
- JVM Up Time
Threads:
- Daemon Thread Count
- Peak Thread Count
- Active Thread Count
- Total Started Thread Count
- Current Thread CPU Time
- Current Thread User Time
Memory:
- Committed Heap Memory
- Initial Heap Memory
- Maximum Heap Memory
- Used Heap Memory
- Heap Memory Used Percentage
- Committed Non-Heap Memory
- Initial Non-Heap Memory
- Maximum Non-Heap Memory
- Used Non-Heap Memory
- Non-Heap Memory Used Percentage
Java Classes:
- Total Classes
- Current Locaded Classes
- Unloaded Classes
Garbage Collectors:
- Garbage Collection Count
- Garbage Collection Rate
- Garbage Collection Time
- Average Garbage Collection Time
Communication Protocols:
- JMX
Runtime Environments
Behpaya Co. All rights reserved